EXAMPLE 4Identifying the Shape of a Scatter Plot
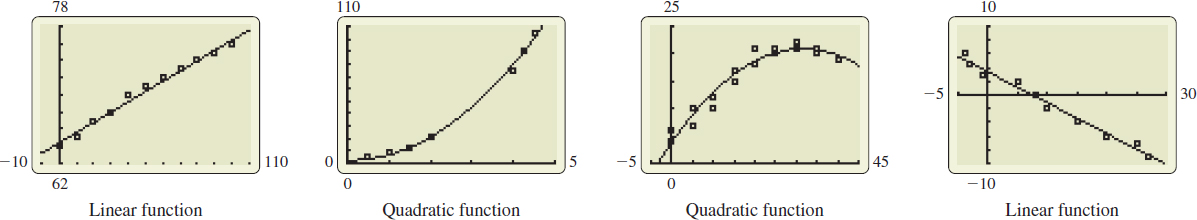
Determine whether you would model the relation between the two variables shown in each scatter plot in Figure 35 with a linear function or a quadratic function.
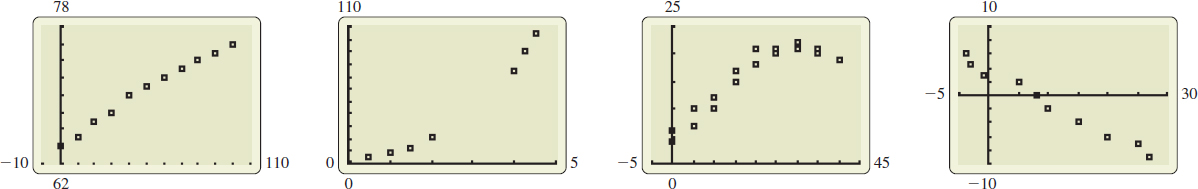
Solution For each scatter plot, we choose a function whose graph closely resembles the shape of the scatter plot. See Figure 36.