EXAMPLE 5Building a Function from Data
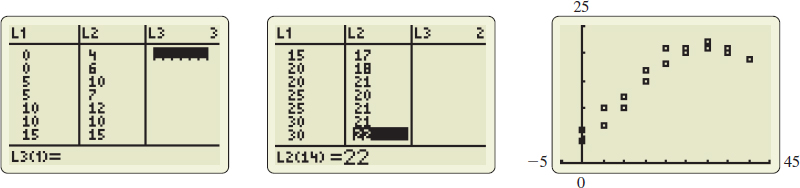
![]() The data shown in Table 3 measure crop yield for various amounts of fertilizer:
The data shown in Table 3 measure crop yield for various amounts of fertilizer:
- (a) Draw a scatter plot of the data and determine a possible type of relation that may exist between the two variables.
- (b) Use technology to find the function of best fit to these data.
Solution (a) Figure 37 on page 22 shows the scatter plot. The data suggest the graph of a quadratic function.
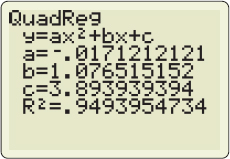
(b) The graphing calculator screen in Figure 38 shows that the quadratic function of best fit is Y(x)=−0.017x2+1.0765x+3.8939 where x represents the amount of fertilizer used and Y represents crop yield. The graph of the quadratic model is illustrated in Figure 39.
22