EXAMPLE 5Investigating a Limit Using a Graph
Use a graph to investigate lim if f( x) =\left\{ \begin{array}{l@{\qquad}l} x & \hbox{if }\quad x<0 \\ 1 & \hbox{if }\quad x>0 \end{array} \right. .
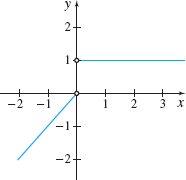
Figure 13 f( x) =\left\{ \begin{array}{l@{\qquad}l} x & \hbox{if }\quad x<0 \\ 1 & \hbox{if }\quad x>0 \end{array} \right.
Solution Figure 13 shows the graph of f. We first investigate the one-sided limits. The graph suggests that, as x approaches 0 from the left, \begin{equation*} \lim_{x\rightarrow 0^{-}}f(x)=0 \end{equation*}
and as x approaches 0 from the right, \begin{equation*} \lim_{x\rightarrow 0^{+}}f(x)=1 \end{equation*}
Since there is no single number that the values of f approach when x is close to 0, we conclude that \lim\limits_{x\rightarrow 0}f(x) does not exist.