EXAMPLE 5Graphing the Derivative Function
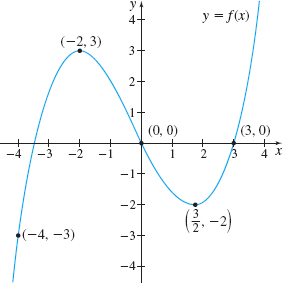
Use the graph of the function y= f(x), shown in Figure 11, to sketch the graph of the derivative function y=f′(x).
Solution We begin by drawing tangent lines to the graph of f at the points shown in Figure 11. See the graph at the top of Figure 12. At the points (−2,3) and (32,−2) the tangent lines are horizontal, so their slopes are 0. This means f′(−2)=0 and f′(32)=0, so the points (−2,0) and (32,0) are on the graph of the derivative function. Now we estimate the slope of the tangent lines at the other selected points. For example, at the point (−4,−3). the slope of the tangent line is positive and the line is rather steep. We estimate the slope to be close to 6, and we plot the point (−4,6) on the bottom graph of Figure 12. Continue the process and then connect the points with a smooth curve.