EXAMPLE 1Finding and Interpreting Differentials Geometrically
For the function f(x)=xex:
- (a) Find the differential dy.
- (b) Compare dy to Δy when x=0 and Δx=0.5.
- (c) Compare dy to Δy when x=0 and Δx=0.1.
- (d) Compare dy to Δy when x=0 and Δx=0.01.
- (e) Discuss the results.
Solution (a) dy=f′(x)dx=(xex+ex)dx=(x+1)exdx.
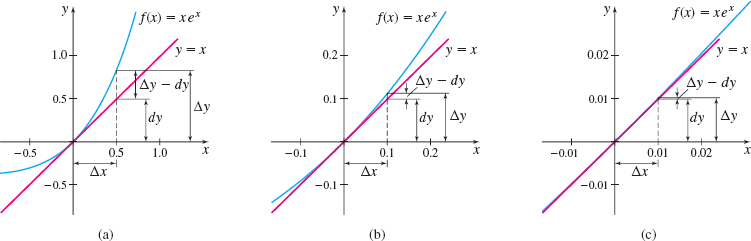
(b) See Figure 9(a). When x=0 and Δx=dx=0.5, then dy=(x+1)exdx=(0+1)e0(0.5)=0.5


232
The tangent line rises by 0.5 as x changes from 0 to 0.5. The corresponding change in the height of the graph f is Δy=f(x+Δx)−f(x)=f(0.5)−f(0)=0.5e0.5−0≈0.824|Δy−dy|≈|0.824−0.5|=0.324
The graph of the tangent line is approximately 0.324 below the graph of f at x=0.5.
(c) See Figure 9(b). When x=0 and Δx=dx=0.1, then dy=(0+1)e0(0.1)=0.1
The tangent line rises by 0.1 as x changes from 0 to 0.1. The corresponding change in the height of the graph f is Δy=f(x+Δx)−f(x)=f(0.1)−f(0)=0.1e0.1−0≈0.111|Δy−dy|≈|0.111−0.1|=0.011
The graph of the tangent line is approximately 0.011 below the graph of f at x=0.1.
(d) See Figure 9(c). When x=0 and Δx=dx=0.01, then dy=(0+1)e0(0.01)=0.01
The tangent line rises by 0.01 as x changes from 0 to 0.01. The corresponding change in the height of the graph of f is Δy=f(x+Δx)−f(x)=f(0.01)−f(0)=0.01e0.01−0≈0.0101|Δy−dy|≈|0.0101−0.01|=0.0001
The graph of the tangent line is approximately 0.0001 below the graph of f at x=0.01.
(e) The closer Δx is to 0, the closer dy is to Δy. So, we conclude that the closer Δx is to 0, the less the tangent line departs from the graph of the function. That is, we can use the tangent line to f at a point P as a linear approximation to f near P.