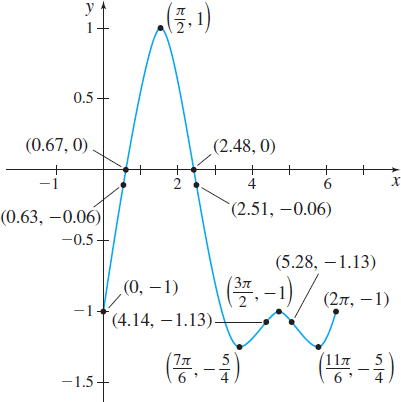
EXAMPLE 6Using Calculus to Graph a Trigonometric Function
Graph f(x)=sinx−cos2x, 0≤x≤2π .
Solution
Step 1 The domain of f is {x|0≤x≤2π}. Since f(0)=sin0−cos20=−1, the y-intercept is −1. The x-intercepts satisfy the equation sinx−cos2x=sinx−(1−sin2x)=sin2x+sinx−1=0
This trigonometric equation is quadratic in form, so we use the quadratic formula. sinx=−1±√1−4(1)(−1)2=−1±√52
Trigonometric equations are discussed in Section P. 7, pp. 61-63.
Since −1−√52<−1 and −1≤sinx≤1, the x -intercepts occur at x=sin−1(−1+√52)≈0.67 and at x=π−sin−1(−1+√52)≈2.48. Plot the intercepts.
Step 2 The function f has no asymptotes.
Step 3 f′(x)=ddx(sinx−cos2x)=cosx+2cosxsinx=cosx(1+2sinx)f″
The critical numbers occur where f^\prime (x) =0. That is, where \cos x=0 \qquad\hbox{or}\qquad 1+2\sin x=0
315
In the interval [0,2\pi ] : \cos x=0 if x=\dfrac{\pi }{2} or if x=\dfrac{3\pi }{2}; and 1+2\sin x=0 when \sin x=-\dfrac{1}{2}, that is, when x=\dfrac{7\pi }{6} or x=\dfrac{11\pi }{6}. So, the critical numbers are \dfrac{\pi }{2}, \dfrac{7\pi }{6}, \dfrac{3\pi }{2}, and \dfrac{11\pi }{6}. At each of these numbers, the tangent lines are horizontal.
Step 4 To apply the Increasing/Decreasing Function Test, we use the numbers 0, \dfrac{\pi }{2}, \dfrac{7\pi }{6}, \dfrac{3\pi }{2}, \dfrac{11\pi }{6}, and 2\pi to form five intervals.
| Interval | Sign of fs^\prime | Conclusion |
|---|---|---|
| \left( 0,\dfrac{\pi }{2}\right) | positive | f is increasing on \left( 0,\dfrac{\pi }{2}\right) |
| \left( \dfrac{\pi }{2},\dfrac{7\pi }{6}\right) | negative | f is decreasing on \left( \dfrac{\pi }{2},\dfrac{7\pi}{6}\right) |
| \left(\dfrac{7\pi}{6},\dfrac{3\pi}{2}\right) | positive | f is increasing on \left( \dfrac{7\pi }{6},\dfrac{3\pi}{2}\right) |
| \left( \dfrac{3\pi }{2},\dfrac{11\pi }{6}\right) | negative | f is decreasing on \left( \dfrac{3\pi }{2},\dfrac{11\pi }{6}\right) |
| \left( \dfrac{11\pi }{6},2\pi \right) | positive | f is increasing on \left( \dfrac{11\pi }{6},2\pi \right) |
Step 5 By the First Derivative Test, f\left( \dfrac{\pi }{2} \right) =1 and f\left( \dfrac{3\pi }{2}\right) =-1 are local maximum values, and f\left(\dfrac{7\pi}{6}\right) =-\dfrac{5}{4} and f\left(\dfrac{11\pi}{6}\right) =-\dfrac{5}{4} are local minimum values. Plot these points.

Step 6 We apply the Test for Concavity. To solve f^{\prime \prime} (x) >0 and f^{\prime \prime} (x) <0, we first solve the equation f^{\prime \prime} (x) =-4\sin ^{2}x-\!\sin x+2=0, or equivalently, \begin{eqnarray*} 4\sin ^{2}x+\sin x-2 &=&0 \qquad 0\leq x\leq 2\pi \\[3pt] \sin x &=&\dfrac{-1\pm \sqrt{1+32}}{8} \\[3pt] \sin x &\approx &0.593\qquad \hbox{or}\qquad \sin x\approx -0.843 \\ x &\approx &0.63 \qquad x\approx 2.51 \qquad x\approx 4.14 \qquad x\approx 5.28 \end{eqnarray*}
We use these numbers to form five subintervals of [0,2\pi ].
| Interval | Sign of f^{\prime \prime} | Conclusion |
|---|---|---|
| (0,0.63) | positive | f is concave up on the interval ( 0,0.63) |
| ( 0.63,2.51) | negative | f is concave down on the interval ( 0.63,2.51) |
| ( 2.51,4.14) | positive | f is concave up on the interval ( 2.51,4.14) |
| ( 4.14,5.28) | negative | f is concave down on the interval ( 4.14,5.28) |
| ( 5.28,2\pi ) | positive | f is concave up on the interval ( 5.28,2\pi ) |
The inflection points are ( 0.63,-0.06) , (2.51,-0.06) , ( 4.14,-1.13) , and ( 5.28,-1.13) . Plot the inflection points.
The function f in Example 6 is periodic with period 2\pi. To graph this function over its unrestricted domain, the set of real numbers, repeat the graph in Figure 51 over intervals of length 2\pi.
Step 7 The graph of f is given in Figure 51.