EXAMPLE 7Using Calculus to Graph a Function
Graph f(x)=ex(x2−3).
Solution
Step 1 The domain of f is all real numbers. Since f(0)=−3, the y-intercept is −3. The x -intercepts occur where f(x)=ex(x2−3)=0x=√3orx=−√3
Plot the intercepts.
Step 2 Since the domain of f is all real numbers, there are no vertical asymptotes. To determine if there is a horizontal asymptote, we find the limits at infinity. lim
Since e^{x} ( x^{2}-3 ) is an indeterminate form at -\infty of the type 0\cdot \infty , we write e^{x} ( x^{2}-3 ) =\dfrac{x^{2}-3}{e^{-x}} and use L’Hôpital’s Rule.
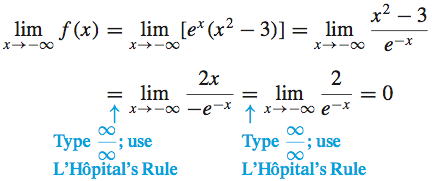
The line y=0 is a horizontal asymptote as x\rightarrow -\infty.
Since \lim\limits_{x\rightarrow \infty }[ e^{x}( x^{2}-3) ] =\infty , there is no horizontal asymptote as x\rightarrow \infty . Draw the asymptote on the graph.
Step 3 \begin{array}{@{}rcl} f^\prime (x) &=&\dfrac{d}{\textit{dx}}[e^{x}( x^{2}-3) ] =e^{x}(2x) +e^{x}(x^{2}-3) =e^{x}( x^{2}+2x-3)\\[8pt] &=&e^{x}( x+3) ( x-1)\\[11pt] f^{\prime \prime} (x) &=&\dfrac{d}{\textit{dx}}[e^{x}( x^{2}+2x-3) ] =e^{x}( 2x+2) +e^{x}(x^{2}+2x-3)\\[8pt] &=&e^{x}( x^{2}+4x-1) \end{array}
Solving f^\prime (x) =0, we find that the critical numbers are -3 and 1.
Step 4 To apply the Increasing/Decreasing Function Test, we use the critical numbers -3 and 1 to form three intervals.
| Interval | Sign of f^\prime | Conclusion |
|---|---|---|
| ( -\infty ,-3) | positive | f is increasing on the interval ( -\infty ,-3) |
| (-3,1) | negative | f is decreasing on the interval ( -3,1) |
| (1,\infty ) | positive | f is increasing on the interval (1,\infty ) |
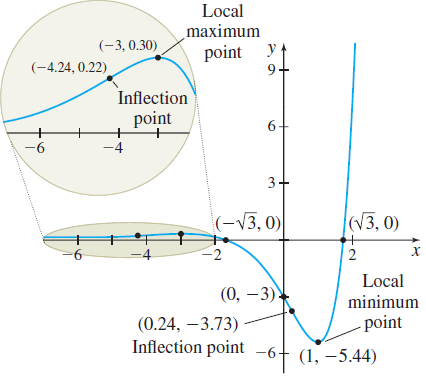
Step 5 We use the First Derivative Test to identify the local extrema. From the table in Step 4, there is a local maximum at -3 and a local minimum at 1. Then f(-3) =6e^{-3}\approx 0.30 is a local maximum value and f(1) =-2e\approx -5.44 is a local minimum value. Plot the local extrema.
317
Step 6 To determine the concavity of f, first we solve f^{\prime \prime} (x) =0. We find x=-2\pm \sqrt{5}. Now we use the numbers -2-\sqrt{5}\approx -4.24 and -2+\sqrt{5}\approx 0.24 to form three intervals and apply the Test for Concavity.
| Interval | Sign of {f''} | Conclusion |
|---|---|---|
| ( -\infty ,-2-\sqrt{5}) | positive | f is concave up on the interval (-\infty ,-2 - \sqrt{5}) |
| (-2-\sqrt{5},-2+\sqrt{5}) | negative | f is concave down on the interval ( -2 -\sqrt{5}, -2+\sqrt{5}) |
| (-2+\sqrt{5},\infty) | positive | f is concave up on the interval ( -2+\sqrt{5},\infty ) |
The inflection points are ( -4.24,0.22) and ( 0.24,-3.73) . Plot the inflection points.
Step 7 The graph of f is given in Figure 52.