EXAMPLE 2Approximating Area Using Lower Sums
Approximate the area A under the graph of f(x)=x2 from 0 to 10 by using lower sums sn (rectangles that lie under the graph) for:
- (a) n=2 subintervals
- (b) n=5 subintervals
- (c) n=10 subintervals
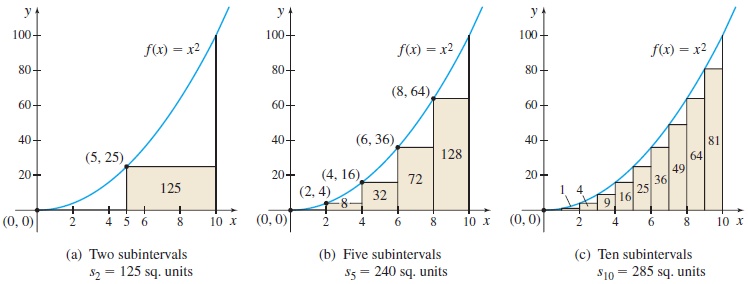
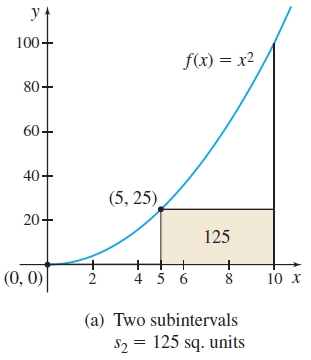
Solution (a) For n=2, we partition the closed interval [0,10] into two subintervals [0,5] and [5,10], each of length Δx=10−02=5. See Figure 9(a). To compute s2, we need to know where f attains its minimum value in each subinterval. Since f is an increasing function, the absolute minimum is attained at the left endpoint of each subinterval. So, for n=2, the minimum of f on [0,5] occurs at 0 and the minimum of f on [5,10] occurs at 5. The lower sum s2 is
347
s2=2∑i=1 f(ci)Δx=Δx2∑i=1f(ci)=↑Δx=5f(c1)=f(0);f(c2)=f(5)5[ f(0)+f(5)]=↑f(0)=0f(5)=255(0+25)=125
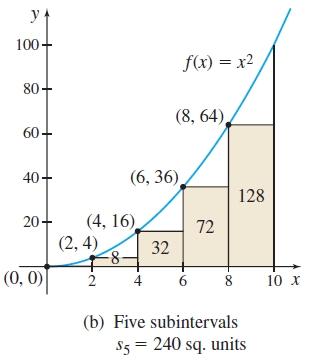
(b) For n=5, partition the interval [0,10] into five subintervals [0,2], [2,4], [4,6], [6,8], [8,10], each of length Δx=10−05=2. See Figure 9(b). The lower sum s5 is s5=5∑i=1f(ci)Δx=Δx5∑i=1f(ci)=2[f(0)+f(2)+f(4)+f(6)+f(8)]=2(0+4+16+36+64)=240
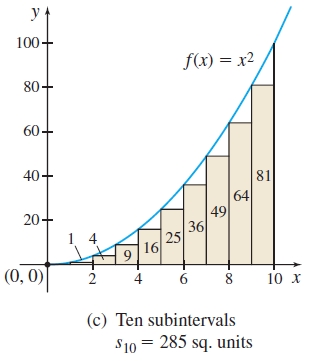
(c) For n=10, partition [0,10] into 10 subintervals, each of length Δx=10−010=1. See Figure 9(c). The lower sum s10 is s10=10∑i=1f(ci)Δx=Δx10∑i=1f(ci)=1[f(0)+f(1)+f(2)+⋯+f(9)]=0+1+4+9+16+25+36+49+64+81=285