EXAMPLE 1Graphing a Plane Curve
Graph the plane curve represented by the parametric equations x(t)=3t2y(t)=2t−2≤t≤2
Indicate the orientation of the curve.
Solution Corresponding to each number t, −2≤t≤2, there are a number x and a number y that are the coordinates of a point (x,y) on the curve. We form a table listing various choices of the parameter t and the corresponding values for x and y, as shown in Table 1.
The motion begins when t=−2 at the point (12,−4) and ends when t=2 at the point (12,4). Figure 2 illustrates the plane curve whose parametric equations are x(t)=3t2 and y(t)=2t. The arrows indicate the orientation of the plane curve for increasing values of the parameter t.
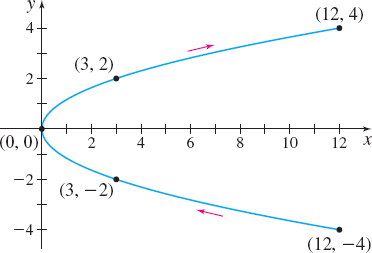
Figure 2 x(t)=3t2,y(t)=2t,−2≤t≤2