EXAMPLE 5Identifying and Graphing a Polar Equation
Identify and graph each equation:
(a) r=3
(b) θ=π4
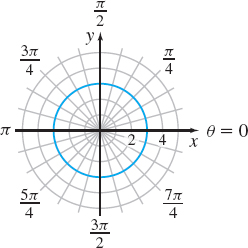
Figure 39 r=3 or x2+y2=9.
Solution (a) If r is fixed at 3 and θ is allowed to vary, the graph is a circle with its center at the pole and radius 3, as shown in Figure 39. To confirm this, we convert the polar equation r=3 to a rectangular equation. r=3r2=9Square both sides.x2+y2=9r2=x2+y2
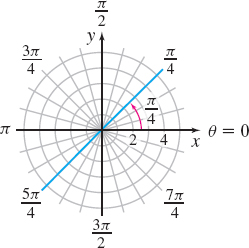
Figure 40 θ=π4 or y=x.
(b) If θ is fixed at π4 and r is allowed to vary, the result is a line containing the pole, making an angle of π4 with the polar axis. That is, the graph of θ=π4 is a line containing the pole with slope tanθ=tanπ4=1, as shown in Figure 40. To confirm this, we convert the polar equation to a rectangular equation. θ=π4tanθ=tanπ4yx=1y=x