EXAMPLE 6Identifying and Graphing Polar Equations
Identify and graph the equations:
(a) rsinθ=2
(b) r=4sinθ
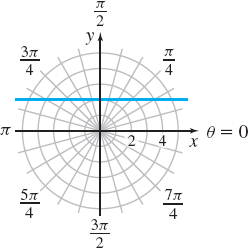
Solution (a) Here, both r and θ are allowed to vary, so the graph of the equation is not as obvious. If we use the fact that y=rsinθ, the equation rsinθ=2 becomes y=2. So, the graph of rsinθ=2 is the horizontal line y=2 that lies 2 units above the pole, as shown in Figure 41.
(b) To convert the equation r=4sinθ to rectangular coordinates, we multiply the equation by r to obtain r2=4rsinθ
Now we use the formulas r2=x2+y2 and y=rsinθ. Then r2=4rsinθx2+y2=4yr2=x2+y2,rsinθ=yx2+(y2−4y)=0x2+(y2−4y+4)=4Complete the square in y.x2+(y−2)2=4Factor.
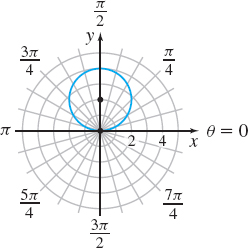
This is the standard form of the equation of a circle with its center at the point (0,2) and radius 2 in rectangular coordinates. See Figure 42. Notice that the circle passes through the pole.