Conducting Primary Research
Printed Page 130-143
Conducting Primary Research
Although the library and the Internet offer a wealth of authoritative information, in the workplace you will often need to conduct primary research because you need new information. There are eight major categories of primary research: analysis of social-media data, observations and demonstrations, inspections, experiments, field research, interviews, inquiries, and questionnaires.
ANALYSIS OF SOCIAL-MEDIA DATA
Every hour, people post about 30 million comments, about 7 million photos, and some 453 years of video footage on social media (McCaney, 2013). A torrent of information is continuously coming online, and many organizations are working hard to sift through it to find useful insights.
Businesses are spending the most time on social-media research, trying to figure out what customers like and dislike about their products and services, learn what they want, and reinforce brand loyalty. Take the case of Nielsen, which for fifty years has been monitoring the TV viewing habits of Americans by distributing questionnaires and attaching devices to their TVs, and then selling the data it collects to TV networks and producers, who use the information to determine how much to charge advertisers. The problem at Nielsen is that many people don’t watch TV on TV or they don’t watch shows when they are broadcast. Now Nielsen also uses social-media analysis: gathering data by monitoring social media to listen in on what people are saying on Twitter, Facebook, and other services about different TV programs (DeVault, 2013).
But organizations other than businesses are analyzing social-media data, too. For instance, the U.S. Geological Survey created the Twitter Earthquake Detector (TED), a program to monitor Twitter for the use of the word earthquake. Why? Because they realized that when people experience earthquakes, a lot of them tweet about it. The Centers for Disease Control, a U.S. federal agency, analyzes keywords on social media to monitor the spread of diseases, such as the H7N9 flu virus, in the United States and around the world. According to one scientist, “The world is equipped with human sensors—more than 7 billion and counting. It’s by far the most extensive sensor network on the planet. What can we learn by paying attention?” (McCaney, 2013).
One more example: in 2008, an article in a medical journal suggested that lithium might slow down the progression of ALS, a condition sometimes called Lou Gehrig’s Disease. But the study reported on only a small number of patients with ALS. When other people with ALS heard about the article, they suggested gathering data from people with ALS across the country. Some 596 patients volunteered: some who were already using lithium, some who were not, and some who started using it (with the approval of their doctors). Although studies such as this do not replace controlled double-blind experiments (in which neither the patients nor the researchers know whether the patients received the therapy), they are much faster and cheaper, and they can help researchers determine how to use their limited experimental resources wisely. According to the director of the ALS study, “sometimes the alternative is not our way or the old way. It is our way or it is not studied at all” (Marcus, 2011).
How do you perform social-media data analysis? There are many software programs that can help you devise searches. Among the most popular is HootSuite, which includes tools for listening in on what people are saying about your company on social media such as Twitter, Facebook, LinkedIn, and many other services. In addition, HootSuite helps you monitor and manage your company’s social-media presence and provides analytics: demographic data about who is following your company, their attitudes, and their behaviors. Figure 6.6 shows a HootSuite dashboard, the screen that lets you view and manage all the information.
Like other similar tools for managing social media, HootSuite enables you to keep your personal and business social media separate. Here we see a portion of a person’s personal social-media feed.
You set up “streams,” which are filters that enable you to see only those tweets and other media that meet certain criteria. For instance, “News Feed” filters out everything that is not news. “News Feed— Photos” shows only news items that include photos. “Mentions” shows only those items in which you are mentioned.
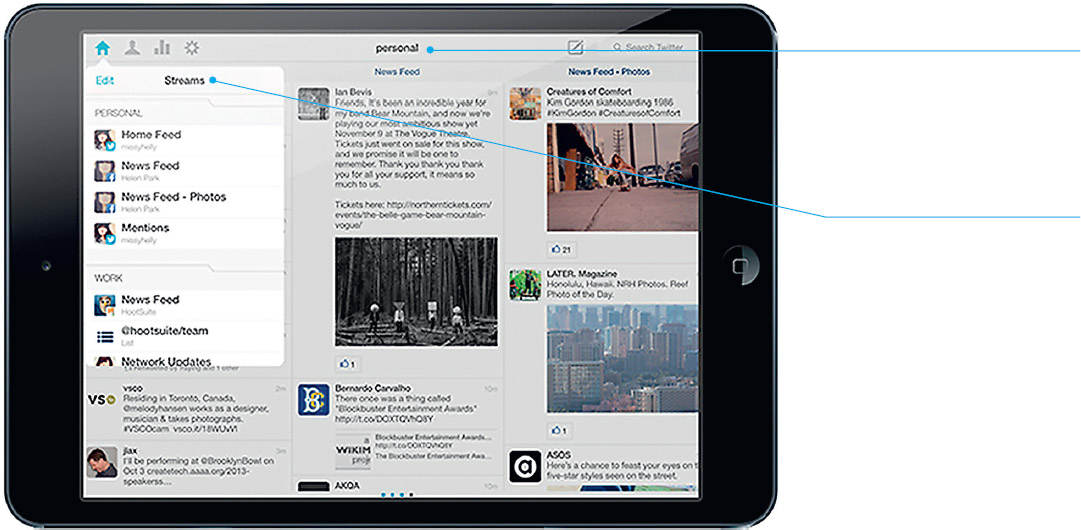
Figure 6.6 A Hootsuite Dashboard
OBSERVATIONS AND DEMONSTRATIONS
Observation and demonstration are two common forms of primary research. When you observe, you simply watch some activity to understand some aspect of it. For instance, if you were trying to determine whether the location of the break room was interfering with work on the factory floor, you could observe the situation, preferably at different times of the day and on different days of the week. If you saw workers distracted by people moving in and out of the room or by sounds made in the room, you would record your observations by taking notes, taking photos, or shooting video of events. An observation might lead to other forms of primary research. You might, for example, follow up by interviewing some employees who could help you understand what you observed.
When you witness a demonstration (or demo), you are watching someone carry out a process. For instance, if your company was considering buying a mail-sorting machine, you could arrange to visit a manufacturer’s facility, where technicians would show how the machine works. If your company was considering a portable machine, such as a laptop computer, manufacturers or dealers could demo their products at your facility.
When you plan to observe a situation or witness a demo, prepare beforehand. Write down the questions you need answered or the factors you want to investigate. Prepare interview questions in case you have a chance to speak with someone. Think about how you are going to incorporate the information you acquire into the document you will write. Finally, bring whatever equipment you will need (pen and paper, computer, camera, etc.) to the site of the observation or demo.
INSPECTIONS
Inspections are like observations, but you participate more actively. For example, a civil engineer can determine what caused a crack in a foundation by inspecting the site: walking around, looking at the crack, photographing it and the surrounding scene, examining the soil. An accountant can determine the financial health of an organization by inspecting its financial records, perhaps performing calculations and comparing the data she finds with other data.
These professionals are applying their knowledge and professional judgment as they inspect a site, an object, or a document. Sometimes inspection techniques are more complicated. A civil engineer inspecting foundation cracking might want to test his hunches by bringing soil samples back to the lab for analysis.
When you carry out an inspection, do your homework beforehand. Think about how you will use the data in your document: will you need photographs or video files or computer data? Then prepare the materials and equipment you’ll need to capture the data.
EXPERIMENTS
Learning to conduct the many kinds of experiments used in a particular field can take months or even years. This discussion is a brief introduction. In many cases, conducting an experiment involves four phases.
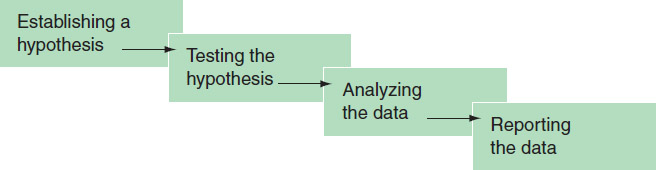
- Establishing a hypothesis. A hypothesis is an informed guess about the relationship between two factors. In a study relating gasoline octane and miles per gallon, a hypothesis might be that a car will get 5 percent better mileage with 89-octane gas than with 87-octane gas.
- Testing the hypothesis. Usually, you need an experimental group and a control group. These two groups should be identical except for the condition you are studying: in the above example, the gasoline. The control group would be a car running on 87 octane. The experimental group would be an identical car running on 89 octane. The experiment would consist of driving the two cars over an identical course at the same speed—preferably in some sort of controlled environment—over a given distance, such as 1,000 miles. Then you would calculate the miles per gallon. The results would either support or refute your original hypothesis.
- Analyzing the data. Do your data show a correlation—one factor changing along with another—or a causal relationship? For example, we know that sports cars are involved in more fatal accidents than sedans (there is a stronger correlation for sports cars), but we don’t know what the causal relationship is—whether the car or the way it is driven is the important factor.
- Reporting the data. When researchers report their findings, they explain what they did, why they did it, what they saw, what it means, and what ought to be done next.
FIELD RESEARCH
Whereas an experiment yields quantitative data that typically can be measured precisely, most field research is qualitative; that is, it yields data that typically cannot be measured precisely. Often in field research, you seek to understand the quality of an experience. For instance, you might want to understand how a new seating arrangement affects group dynamics in a classroom. You could design a study in which you observed and shot video of classes and interviewed the students and the instructor about their reactions to the new arrangement. Then you could do the same in a traditional classroom and compare the results.
Some kinds of studies have both quantitative and qualitative elements. In the case of classroom seating arrangements, you could include some quantitative measures, such as the number of times students talked with one another. You could also distribute questionnaires to elicit ratings by the students and the instructor. If you used these same quantitative measures on enough classrooms, you could gather valid quantitative information.
When you are doing quantitative or qualitative studies on the behavior of animals—from rats to monkeys to people—try to minimize two common problems:
- The effect of the experiment on the behavior you are studying. In studying the effects of the classroom seating arrangement, minimize the effects of your own presence. For instance, if you observe in person, avoid drawing attention to yourself. Also, make sure that the video camera is placed unobtrusively and that it is set up before the students arrive, so they don’t see the process. Still, any time you bring in a camera, you cannot be sure that what you witness is typical.
- Bias in the recording and analysis of the data. Bias can occur because researchers want to confirm their hypotheses. In an experiment to determine whether students write differently on physical keyboards than on touch screens, a researcher might see differences where other people don’t. For this reason, the experiment should be designed so that it is double blind. That is, the students shouldn’t know what the experiment is about so that they don’t change their behavior to support or negate the hypothesis, and the data being analyzed should be disguised so that researchers don’t know whether they are examining the results from the control group or the experimental group. For example, the documents produced on keyboards and touch screens should be printed out the same way.
Conducting an experiment or field research is relatively simple; the hard part is designing your study so that it accurately measures what you want it to measure.
Interviews are extremely useful when you need information on subjects that are too new to have been discussed in the professional literature or are too narrow for widespread publication (such as local political questions).
In choosing a respondent—a person to interview—answer three questions:
- What questions do you want to answer? Only when you know this can you begin to search for a person who can provide the information.
- Who could provide this information? The ideal respondent is an expert willing to talk. Unless there is an obvious choice, such as the professor carrying out the research you are studying, use directories, such as local industrial guides, to locate potential respondents.
- Is the person willing to be interviewed? Contact the potential respondent by phone or in writing and state what you want to ask about. If the person is not able to help you, he or she might be willing to refer you to someone who can. Explain why you have decided to ask him or her. (A compliment works better than admitting that the person you really wanted to interview is out of town.) Explain what you plan to do with the information, such as write a report or present a talk. Then, if the person is willing to be interviewed, set up an appointment at his or her convenience.
Conducting an Interview

PREPARING FOR THE INTERVIEW
Follow these suggestions for preparing for and conducting an interview—and for following up after the interview.
 Do your homework. If you ask questions that have already been answered in the professional literature, the respondent might become annoyed and uncooperative.
Prepare good questions. Good questions are clear, focused, and open.
— Be clear. The respondent should be able to understand what you are asking.
| UNCLEAR | Why do you sell Trane products? |
| CLEAR | What are the characteristics of Trane products that led you to include them in your product line? |
The unclear question can be answered in a number of unhelpful ways: “Because they’re too expensive to give away” or “Because I’m a Trane dealer.”
— Be focused. The question must be narrow enough to be answered briefly. If you want more information, you can ask a follow-up question.
| UNFOCUSED | What is the future of the computer industry? |
| FOCUSED | What will the American chip industry look like in 10 years? |
— Ask open questions. Your purpose is to get the respondent to talk. Don’t ask a lot of questions that have yes or no answers.
| CLOSED | Do you think the federal government should create industrial partnerships? |
| OPEN | What are the advantages and disadvantages of the federal government’s creating industrial partnerships? |
Check your equipment. If you will be recording the interview, test your voice recorder or video camera to make sure it is operating properly.
BEGINNING THE INTERVIEW
Arrive on time.
Thank the respondent for taking the time to talk with you.
State the subject and purpose of the interview and what you plan to do with the information.
If you wish to record the interview, ask permission.
CONDUCTING THE INTERVIEW
Take notes. Write down important concepts, facts, and numbers, but don’t take such copious notes that you can’t make eye contact with the respondent or that you are still writing when the respondent finishes an answer.
Start with prepared questions. Because you are likely to be nervous at the start, you might forget important questions. Have your first few questions ready.
Be prepared to ask follow-up questions. Listen carefully to the respondent’s answer and be ready to ask a follow-up question or request a clarification. Have your other prepared questions ready, but be willing to deviate from them if the respondent leads you in unexpected directions.
Be prepared to get the interview back on track. Gently return to the point if the respondent begins straying unproductively, but don’t interrupt rudely or show annoyance. Do not say, “Whoa! I asked about layoffs in this company, not in the whole industry.” Rather, say, “On the question of layoffs at this company, do you anticipate . . . ?”
CONCLUDING THE INTERVIEW
Thank the respondent.
Ask for a follow-up interview. If a second meeting would be useful, ask to arrange one.
Ask for permission to quote the respondent. If you think you might want to quote the respondent by name, ask for permission now.
AFTER THE INTERVIEW
Write down the important information while the interview is fresh in your mind. (This step is unnecessary, of course, if you have recorded the interview.) If you will be printing a transcript of the interview, make the transcript now.
Send a brief thank-you note. Within a day or two, send a note showing that you appreciate the respondent’s courtesy and that you value what you have learned. In the note, confirm any previous offers you have made, such as to send the respondent a copy of your final document.
When you wish to present the data from an interview in a document you are preparing, include a transcript of the interview (or an excerpt from the interview). You will probably present the transcript as an appendix so that readers can refer to it but are not slowed down when reading the body of the document. You might decide to present brief excerpts from the transcript in the body of the document as evidence for points you make.
Figure 6.7 is from a transcript of an interview with an attorney specializing in information technology. The interviewer is a student who is writing about legal aspects of software ownership.
The student prompts the attorney to expand her answers.
The student responds to the attorney’s answers, making the interview more of a discussion.
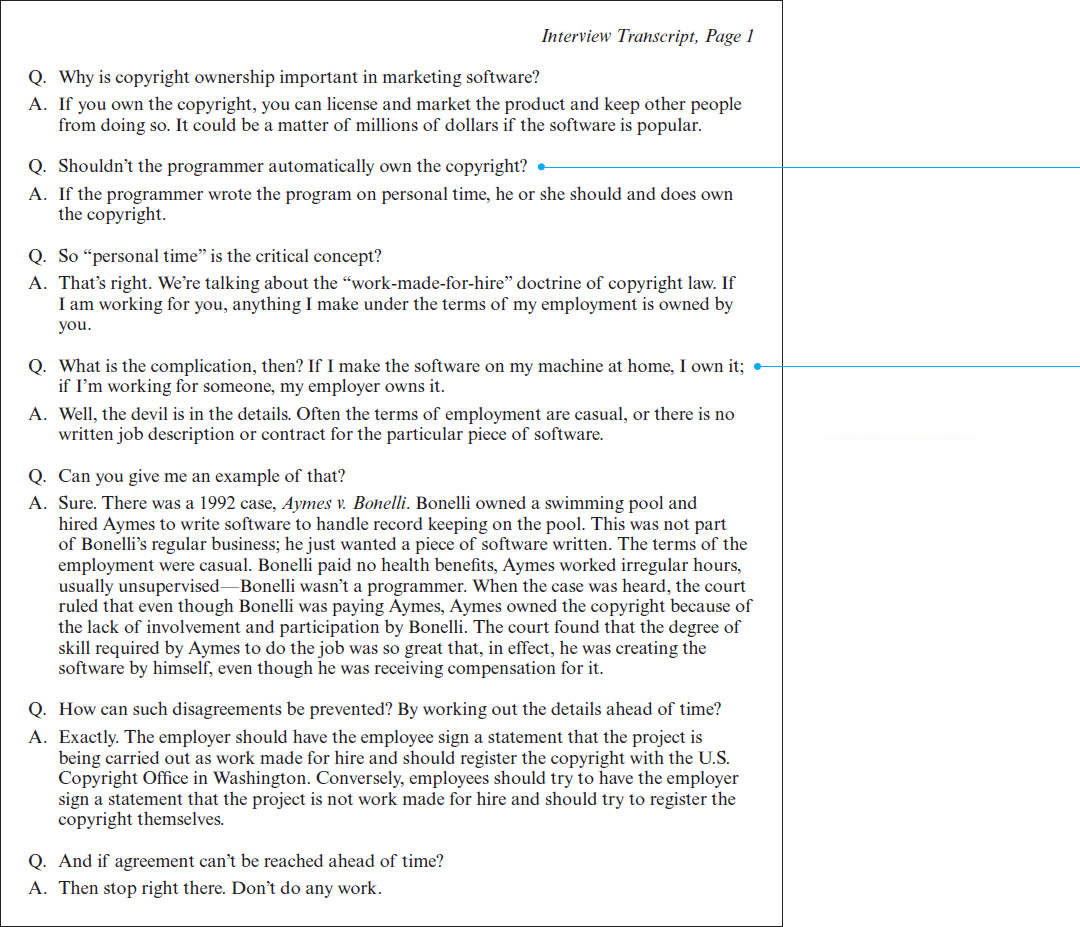
Figure 6.7 EXCERPT FROM AN INTERVIEW
INQUIRIES
A useful alternative to a personal interview is to send an inquiry. This inquiry can take the form of a letter, an email, or a message sent through an organization’s website. Although digital inquiries are more convenient for both the sender and the recipient, a physical letter is more formal and therefore might be more appropriate if the topic is important (concerning personnel layoffs, for instance) or related to safety.
If you are lucky, your respondent will provide detailed and helpful answers. However, the respondent might not clearly understand what you want to know or might choose not to help you. Although the strategy of the inquiry is essentially that of a personal interview, inquiries can be less successful because the recipient has not already agreed to provide information and might not respond. Also, an inquiry, unlike an interview, gives you little opportunity to follow up by asking for clarification.
To find software for conducting surveys, search for “survey software.”
Questionnaires enable you to solicit information from a large group of people. You can send questionnaires through the mail, email them, present them as forms on a website, or use survey software (such as SurveyMonkey).
Unfortunately, questionnaires rarely yield completely satisfactory results, for three reasons:
- Some of the questions will misfire. Respondents will misinterpret some of your questions or supply useless answers.
- You won’t obtain as many responses as you want. The response rate will almost never exceed 50 percent. In most cases, it will be closer to 10 to 20 percent.
- You cannot be sure the respondents are representative. People who feel strongly about an issue are much more likely to respond to questionnaires than are those who do not. For this reason, you need to be careful in drawing conclusions based on a small number of responses to a questionnaire.
When you send a questionnaire, you are asking the recipient to do you a favor. Your goal should be to construct questions that will elicit the information you need as simply and efficiently as possible.
Asking Effective Questions To ask effective questions, follow two suggestions:
- Use unbiased language. Don’t ask, “Should U.S. clothing manufacturers protect themselves from unfair foreign competition?” Instead, ask, “Are you in favor of imposing tariffs on men’s clothing?”
- Be specific. If you ask, “Do you favor improving the safety of automobiles?” only an eccentric would answer no. Instead, ask, “Do you favor requiring automobile manufacturers to equip new cars with electronic stability control, which would raise the price by an average of $300 per car?”
Table 6.2 explains common types of questions used in questionnaires.
Include an introductory explanation with the questionnaire. This explanation should clearly indicate who you are, why you are writing, what you plan to do with the information from the questionnaire, and when you will need it.
| TABLE 6.2 COMMON TYPES OF QUESTIONS USED IN QUESTIONNAIRES | ||
| TYPE OF QUESTION | EXAMPLE | COMMENTS |
| Multiple choice | Would you consider joining a company-sponsored sports team? Yes __ No __ | The respondent selects one of the alternatives. |
| Likert scale |
The flextime program has been a success in its first year. strongly disagree _ _ _ _ _ _ strongly agree |
The respondent ranks the degree to which he or she agrees or disagrees with the statement. Using an even number of possible responses (six, in this case) increases your chances of obtaining useful data. With an odd number, many respondents will choose the middle response. |
| Semantic differentials |
Logging on to the system simple _ _ _ _ _ _ difficult The description of the new desalinization process interesting _ _ _ _ _ _ boring |
The respondent registers a response along a continuum between a pair of opposing adjectives. Usually, these questions measure a person’s feelings about a task, an experience, or an object. As with Likert scales, an even number of possible responses yields better data. |
| Ranking |
Please rank the following work schedules in order of preference. Put a 1 next to the schedule you would most like to have, a 2 next to your second choice, and so on. 8:00–4:30 __ 9:00–5:30 __ 8:30–5:00 __ flexible __ |
The respondent indicates the priority of a number of alternatives. |
| Short answer |
What do you feel are the major advantages of the new parts-requisitioning policy? 1. __________________ 2. __________________ 3. __________________ |
The respondent writes a brief answer using phrases or sentences. |
| Short essay |
The new parts-requisitioning policy has been in effect for a year. How well do you think it is working? _________________ _________________ _________________ _________________ _________________ _________________ |
Although essay questions can yield information you never would have found using closed-ended questions, you will receive fewer responses to them because answering them requires more effort. Also, essays cannot be quantified precisely, as data from other types of questions can. |
Testing the Questionnaire Before you send out any questionnaire, show it and its accompanying explanation to a few people who can help you identify any problems. After you have revised the materials, test them on people whose backgrounds are similar to those of your intended respondents. Revise the materials a second time, and, if possible, test them again. Once you have sent the questionnaire, you cannot revise it and resend it to the same people.
Administering the Questionnaire Determining who should receive the questionnaire can be simple or difficult. If you want to know what the residents of a particular street think about a proposed construction project, your job is easy. But if you want to know what mechanical-engineering students in colleges across the country think about their curricula, you will need a background in sampling techniques to identify a representative sample.
Make it easy for respondents to present their information. For mailed questionnaires, include a self-addressed, stamped envelope.
Figure 6.8 shows a sample questionnaire.
Likert-scale questions 3 and 4 make it easy for the writer to quantify data about subjective impressions.
Short-answer questions 6 and 7 are best for soliciting ideas from respondents.
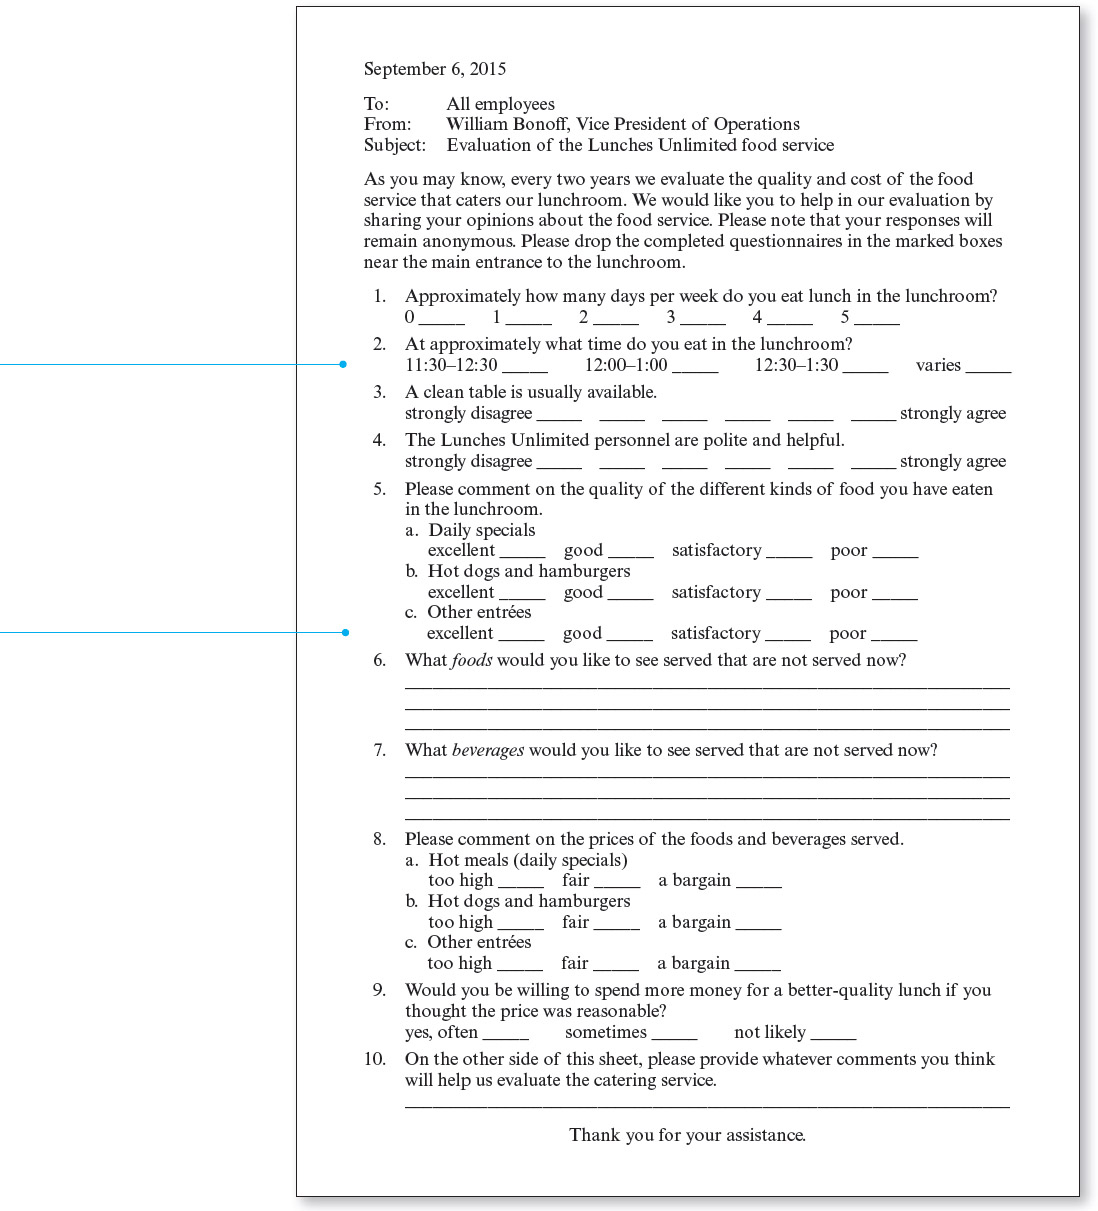
Figure 6.8 Questionnaire
Presenting Questionnaire Data in Your Document To decide where and how to present the data that you acquire from your questionnaire, think about your audience and purpose. Start with this principle: important information is presented and analyzed in the body of a document, whereas less-important information is presented in an appendix (a section at the end that only some of your audience will read). Most often, different versions of the same information appear in both places.
Typically, the full questionnaire data are presented in an appendix. If you can, present the respondents’ data—the answers they provided—in the questionnaire itself, as shown here:
1. Approximately how many days per week do you eat lunch in the lunchroom?
0 12 1 16 2 18 3 12 4 9 5 4
2. At approximately what time do you eat in the lunchroom?
11:30–12:30 3 12:00–1:00 26 12:30–1:30 7 varies 23
Selected data might then be interpreted in the body of the document. For instance, you might devote a few sentences or paragraphs to the data for one of the questions. The following example shows how a writer might discuss the data from question 2.
If you think your reader will benefit from analyses of the data, present such analyses. For instance, you could calculate the percentage for each response: for question 1, “12 people—17 percent—say they do not eat in the cafeteria at all.” Or you could present the percentage in parentheses after each number: “12 (17%).“
Question 2 shows that 26 people say that they use the cafeteria between noon and 1:00. Only 10 people selected the two other times: 11:30–12:30 or 12:30–1:30. Of the 23 people who said they use the cafeteria at various times, we can conclude that at least a third—8 people—use it between noon and 1:00. If this assumption is correct, at least 34 people (26 + 8) use the cafeteria between noon and 1:00. This would explain why people routinely cannot find a table in the noon hour, especially between 12:15 and 12:30. To alleviate this problem, we might consider asking department heads not to schedule meetings between 11:30 and 1:30, to make it easier for their people to choose one of the less-popular times.
The body of a document is also a good place to discuss important nonquantitative data. For example, you might wish to discuss and interpret several representative textual answers to open-ended questions.
ETHICS NOTE
REPORTING AND ANALYZING DATA HONESTLY
When you put a lot of time and effort into a research project, it’s frustrating if you can’t find the information you need or if the information you find doesn’t help you say what you want to say. As discussed in Chapter 2, your responsibility as a professional is to tell the truth.
If the evidence suggests that the course of action you propose won’t work, don’t omit that evidence or change it. Rather, try to figure out why the evidence does not support your proposal. Present your explanation honestly.
If you can’t find reputable evidence to support your claim that one device works better than another, don’t just keep silent and hope your readers won’t notice. Explain why you think the evidence is missing and how you propose to follow up by continuing your research.
If you make an honest mistake, you are a person. If you cover up a mistake, you’re a dishonest person. If you get caught fudging the data, you could be an unemployed dishonest person. If you don’t get caught, you’re still a smaller person.