5.2 The Purification of a Protein Is the First Step in Understanding Its Function

✓ 4 Explain how proteins can be purified.

To understand a protein—its amino acid sequence, its three-dimensional structure, and its function in normal and pathological states—we need to purify the protein. In other words, we need to isolate the protein of interest from the thousands of other proteins in the cell. This protein sample may be only a fraction of 1% of the starting material, whether that starting material consists of cells in culture or a particular organ from a plant or animal. We will examine the purification of two proteins: an enzyme that is purified by standard biochemical techniques, and a hormone-binding protein, called a receptor, that proved refractory to standard biochemical techniques and thus required an immunological approach.

71

Proteins Can Be Purified on the Basis of Differences in Their Chemical Properties

Protein purification requires much ingenuity and patience, but, before we can even undertake the task, we need a test that identifies the protein that we are interested in. We will use this test after each stage of purification to see if the purification is working. Such a test is called an assay, and it is based on some unique identifying property of the protein. For enzymes, which are protein catalysts (Chapter 6), the assay is usually based on the reaction catalyzed by the enzyme in the cell. For instance, the enzyme lactate dehydrogenase, an important enzyme in glucose metabolism, carries out the following reaction:

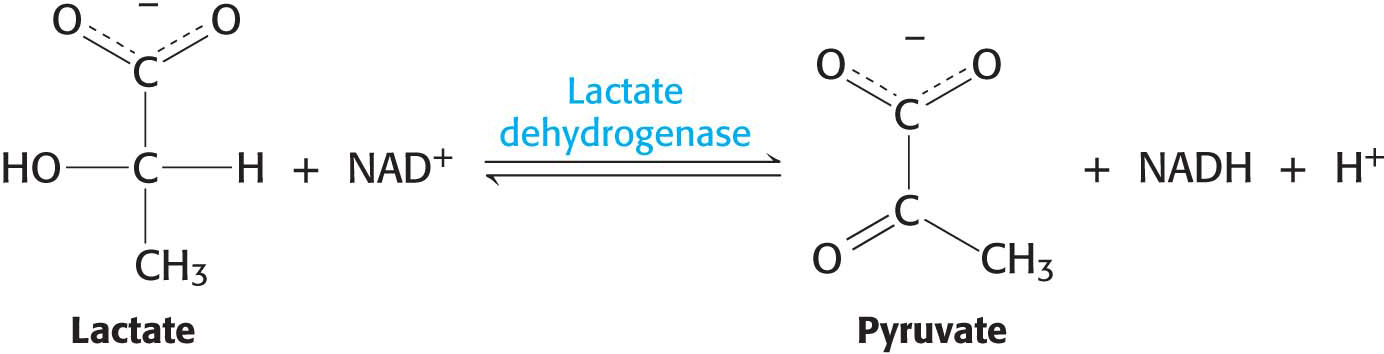
The product, reduced nicotinamide adenine dinucleotide (NADH), in contrast with the other reaction components, absorbs light at 340 nm. Consequently, we can follow the progress of the reaction by measuring the light absorbance at 340 nm in unit time—for instance, within 1 minute after the addition of the sample that contains the enzyme. Our assay for enzyme activity during the purification of lactate dehydrogenase is thus the increase in absorbance of light at 340 nm observed in 1 minute. Note that the assay tells us how much enzyme activity is present, not how much enzyme protein is present.

!quickquiz! QUICK QUIZ 1

Why is an assay required for protein purification?

To be certain that our purification scheme is working, we need one additional piece of information—the amount of total protein present in the mixture being assayed. This measurement of the total amount of protein includes the enzyme of interest as well as all the other proteins present, but it is not a measure of enzyme activity. After we know both how much enzyme activity is present and how much protein is present, we can assess the progress of our purification by measuring the specific activity, the ratio of enzyme activity to the amount of protein in the enzyme assay at each step of our purification. The specific activity will rise as the protein of interest comprises a greater portion of the protein mixture used for the assay. In essence, the point of the purification is to remove all proteins except the protein in which we are interested. Quantitatively, it means that we want to maximize specific activity.

Proteins Must Be Removed from the Cell to Be Purified

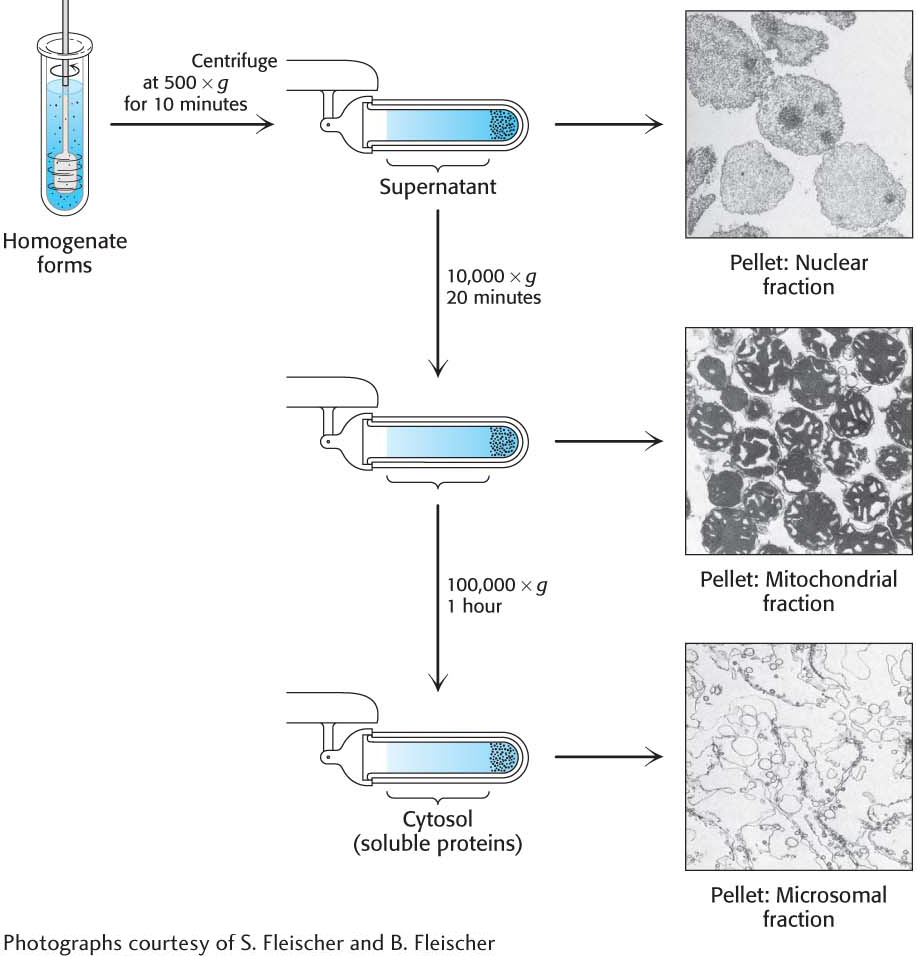
Having found an assay, we must now break open the cells, releasing the cellular contents, so that we can gain access to our protein. The disruption of the cell membranes yields a homogenate, a mixture of all of the components of the cell but no intact cells. This mixture is centrifuged at low centrifugal force, yielding a pellet of heavy material at the bottom of the centrifuge tube and a lighter solution above, called the supernatant. The pellets are enriched in a particular organelle (Figure 5.1). The pellet and supernatant are referred to as fractions because we are fractionating the homogenate. The supernatant is centrifuged again at a greater force to yield yet another pellet and supernatant. This procedure, called differential centrifugation, yields several fractions of decreasing density, each still containing hundreds of different proteins, which are assayed for the activity being purified. Usually, one fraction will have more enzyme activity than any other fraction, and it then serves as the source of material to which more-discriminating purification techniques are applied. The fraction that is used as a source for further purification is often called the crude extract.

Figure 5.1: Differential centrifugation. Cells are disrupted in a homogenizer, and the resulting mixture, called the homogenate, is centrifuged in a step-by-step fashion of increasing centrifugal force. The denser material will form a pellet at lower centrifugal force than the less dense material. The isolated fractions can be used for further purification.

72

Proteins Can Be Purified According to Solubility, Size, Charge, and Binding Affinity

Proteins are purified on the basis of differences in solubility, size, charge, and specific binding affinity. Usually, protein mixtures are subjected to a series of separations, each based on a different property.

Figure 5.2: The dependency of protein solubility on salt concentration. The graph shows how altering the salt concentration affects the solubility of a hypothetical protein. Different proteins will display different curves.

Salting outMost proteins require some salt to dissolve, a process called salting in. However, most proteins precipitate out of solution at high salt concentrations, an effect called salting out (Figure 5.2). Salting out is due to competition between the salt ions and the protein for water to keep the protein in solution (water of solvation). The salt concentration at which a protein precipitates differs from one protein to another. Hence, salting out can be used to fractionate a mixture of proteins. Unfortunately, many proteins lose their activity in the presence of such high concentrations of salt. However, the salt can be removed by the process of dialysis. The protein–salt solution is placed in a small bag made of a semipermeable membrane, such as a cellulose membrane, with pores (Figure 5.3). Proteins are too large to fit through the pores of the membrane, whereas smaller molecules and ions such as salts can escape through the pores and emerge in the medium outside the bag (the dialysate).

Figure 5.3: Dialysis. Protein molecules (red) are retained within the dialysis bag, whereas small molecules (blue) diffuse into the surrounding medium.

Separation by sizeMolecular exclusion chromatography, also called gel-filtration chromatography, separates proteins on the basis of size. The sample is applied to the top of a column consisting of porous beads made of an insoluble polymer such as dextran, agarose, or polyacrylamide (Figure 5.4). Small molecules can enter these beads, but large ones cannot, and so those larger molecules follow a shorter path to the bottom of the column and emerge first. Molecules that are of a size to occasionally enter a bead will flow from the column at an intermediate position, and small molecules, which take a longer, more circuitous path, will exit last.

Figure 5.4: Gel-filtration chromatography. A mixture of proteins in a small volume is applied to a column filled with porous beads. Because large proteins cannot enter the internal volume of the beads, they emerge sooner than do small ones.

73

Figure 5.5: Ion-exchange chromatography. This technique separates proteins mainly according to their net charge.

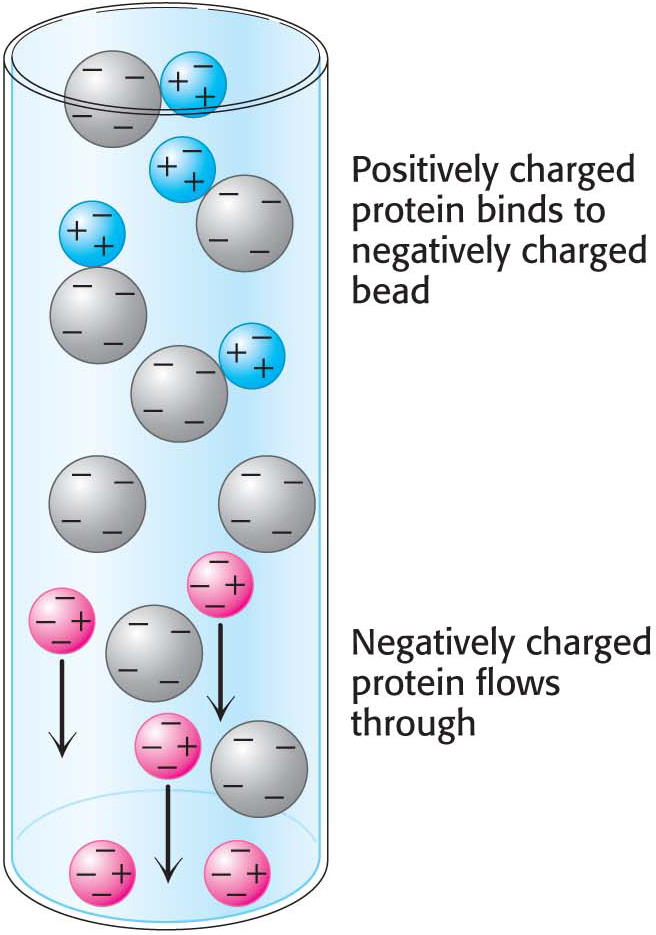
Ion-exchange chromatographyProteins can be separated on the basis of their net charge by ion-exchange chromatography. If a protein has a net positive charge at pH 7, it will usually bind to a column of beads containing negatively charged carboxylate groups, whereas a negatively charged protein will not bind to the column (Figure 5.5). A positively charged protein bound to such a column can then be released by increasing the concentration of salt in the buffer poured over the column. The positively charged ions of the salt compete with positively charged groups on the protein for binding to the column. Likewise, a protein with a net negative charge will be bound to ion-exchange beads carrying positive charges and can be eluted from the column with the use of a buffer containing salt.

74

Affinity chromatographyAffinity chromatography is another powerful means of purifying proteins. This technique takes advantage of the fact that some proteins have a high affinity for specific chemical groups or specific molecules. For example, the plant protein concanavalin A, which binds to glucose reversibly, can be purified by passing a crude extract through a column of beads containing covalently attached glucose residues. Concanavalin A binds to such beads, whereas most other proteins do not. The bound concanavalin A can then be released from the column by adding a concentrated solution of glucose. The glucose in solution displaces the column-attached glucose residues from binding sites on concanavalin A (Figure 5.6).

Figure 5.6: Affinity chromatography. Affinity chromatography of concanavalin a (shown in yellow) on a solid support containing covalently attached glucose residues (G).
Figure 5.7: High-pressure liquid chromatography (HPLC). Gel filtration by HPLC clearly defines the individual proteins because of its greater resolving power. Proteins are detected by their absorbance of 220-nm light waves: (1) thyroglobulin (669 kDa), (2) catalase (232 kDa), (3) bovine serum albumin (67 kDa), (4) ovalbumin (43 kDa), and (5) ribonuclease (13.4 kDa).

High-pressure liquid chromatographyThe ability of column techniques to separate individual proteins, called the resolving power, can be improved substantially through the use of a technique called high-pressure liquid chromatography (HPLC), which is an enhanced version of the column techniques already discussed. The beads that make up the column material themselves are much more finely divided and, as a consequence, there are more interaction sites and thus greater resolving power. Because the column is made of finer material, pressure must be applied to the column to obtain adequate flow rates. The net result is high resolution as well as rapid separation (Figure 5.7).

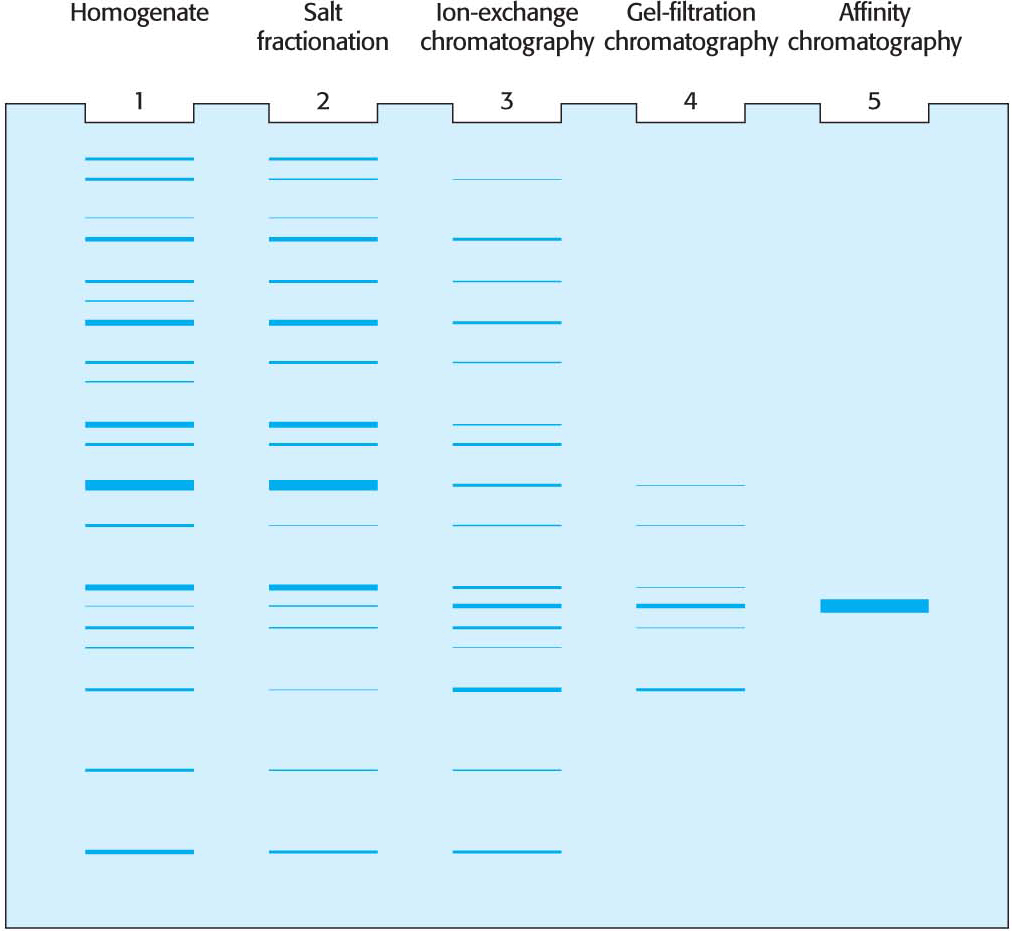
Proteins Can Be Separated by Gel Electrophoresis and Displayed

How can we tell whether a purification scheme is effective? One way is to demonstrate that the specific activity rises with each purification step. Another is to visualize the number of proteins present at each step. The technique of gel electrophoresis makes the latter method possible.

A molecule with a net charge will move in an electric field, a phenomenon termed electrophoresis. The distance and speed that a protein moves in electrophoresis depends on the electric-field strength, the net charge on the protein, which is a function of the pH of the electrophoretic solution, and the shape of the protein. Electrophoretic separations are nearly always carried out in gels, such as polyacrylamide, because the gel serves as a molecular sieve that enhances separation. Molecules that are small compared with the pores in the gel readily move through the gel, whereas molecules much larger than the pores are almost immobile. Intermediate-size molecules move through the gel with various degrees of ease. The electrophoresis of proteins is performed in a thin, vertical slab of polyacrylamide. The pH of the electrophoretic solution is adjusted so that all proteins are negatively charged. The direction of flow is from the cathode (negative charge) to the anode (positive charge) (Figure 5.8).

Figure 5.8: Polyacrylamide-gel electrophoresis. (A) Gel-electrophoresis apparatus. Typically, several samples undergo electrophoresis on one flat polyacrylamide gel. A microliter pipette is used to place solutions of proteins in the wells of the slab. A cover is then placed over the gel chamber and voltage is applied. The negatively charged SDS (sodium dodecyl sulfate)–protein complexes migrate in the direction of the anode, at the bottom of the gel. (B) The sieving action of a porous polyacrylamide gel separates proteins according to size, with the smallest moving most rapidly.

75

Figure 5.9: The staining of proteins after electrophoresis. Proteins subjected to electrophoresis on an SDS–polyacrylamide gel can be visualized by staining with coomassie blue. The lane on the left is a set of marker proteins of known molecular weight. These marker proteins have been separated on the basis of size, with the smaller proteins moving farther into the gel than the larger proteins. Two different protein mixtures are in the remaining lanes.

Proteins can be separated largely on the basis of mass by electrophoresis in a polyacrylamide gel in the presence of the detergent sodium dodecyl sulfate (SDS), a technique called SDS–PAGE (SDS–polyacrylamide-gel electrophoresis). The negatively charged SDS denatures proteins and binds to the denatured protein at a constant ratio of one SDS molecule for every two amino acids in the protein. The negative charges on the many SDS molecules bound to the protein “swamp” the normal charge on the protein and cause all proteins to have the same charge-to-mass ratio. Thus, proteins will differ only in their mass. Finally, a sulfhydryl agent such as mercaptoethanol is added to reduce disulfide bonds and completely linearize the proteins. The SDS–protein complexes are then subjected to electrophoresis. When the electrophoresis is complete, the proteins in the gel can be visualized by staining them with silver or a dye such as Coomassie blue, which reveals a series of bands (Figure 5.9). Small proteins move rapidly through the gel, whereas large proteins stay at the top, near the point of application of the mixture.

Isoelectric focusingProteins can also be separated electrophoretically on the basis of their relative contents of acidic and basic residues. The isoelectric point (pI) of a protein is the pH at which its net charge is zero. At this pH, the protein will not migrate in an electric field. If a mixture of proteins is subjected to electrophoresis in a pH gradient in a gel in the absence of SDS, each protein will move until it reaches a position in the gel at which the pH is equal to the pI of the protein. This method of separating proteins is called isoelectric focusing. Proteins differing by one net charge can be separated (Figure 5.10).

Figure 5.10: The principle of isoelectric focusing. A pH gradient is established in a gel before the sample has been loaded. (A) The sample is loaded, and voltage is applied. The proteins will migrate to their isoelectric pH, the location at which they have no net charge. (B) The proteins form bands that can be excised and used for further experimentation.

Two-dimensional electrophoresisIsoelectric focusing can be combined with SDS–PAGE to obtain very high resolution separations. A single sample is first subjected to isoelectric focusing. This single-lane gel is then placed horizontally on top of an SDS–polyacrylamide slab and subjected to electrophoresis again, in a direction perpendicular to the isoelectric focusing, to yield a two-dimensional pattern of spots. In such a gel, proteins have been separated in the horizontal direction on the basis of pI and in the vertical direction on the basis of mass. More than a thousand different proteins in the bacterium Escherichia coli can be resolved in a single experiment by two-dimensional electrophoresis (Figure 5.11).

Figure 5.11: Two-dimensional gel electrophoresis. (A) A protein sample is initially fractionated in one direction by isoelectric focusing as described in Figure 5.10. The isoelectric-focusing gel is then attached to an SDS–polyacrylamide gel, and electrophoresis is performed in the second direction, perpendicular to the original separation. Proteins with the same pI value are now separated on the basis of mass. (B) Proteins from E. coli were separated by two-dimensional gel electrophoresis, resolving more than a thousand different proteins. The proteins were first separated according to their isoelectric ph in the horizontal direction and then by their apparent mass in the vertical direction.

76

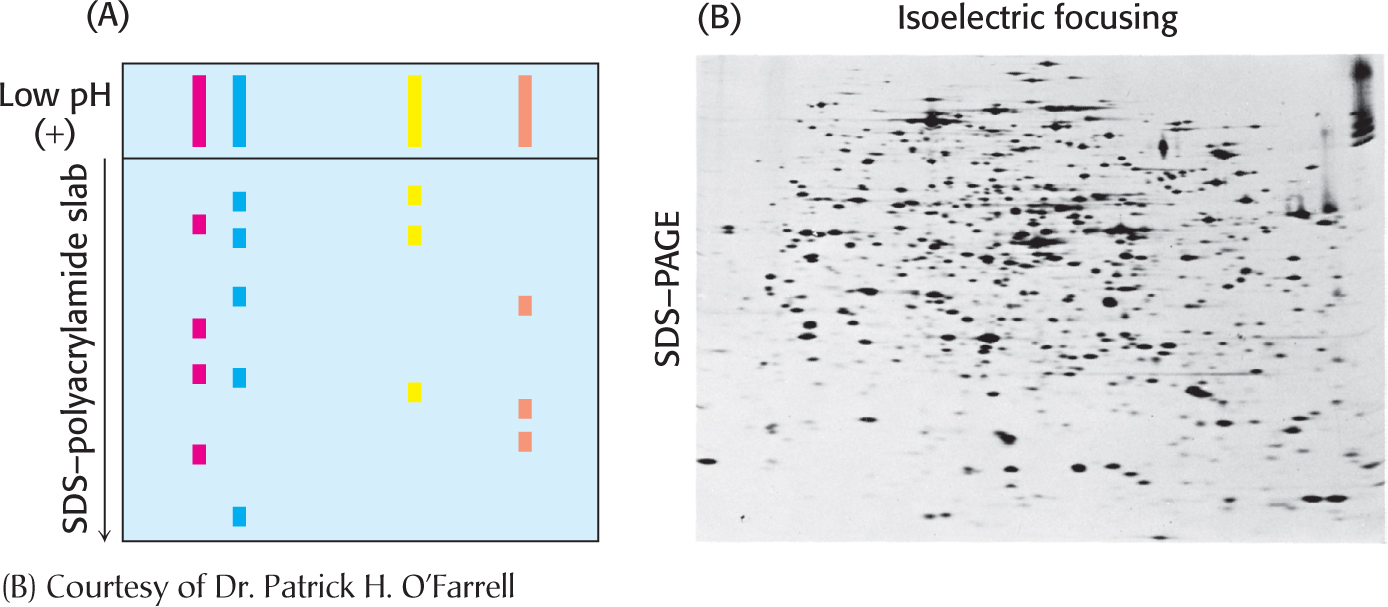
Proteins isolated from cells under different physiological conditions can be subjected to two-dimensional electrophoresis. The intensities of individual spots on the gels can then be compared, which indicates that the concentrations of specific proteins have changed in response to the physiological state (Figure 5.12). How can we discover the identity of a protein that is showing such responses? Although many proteins are displayed on a two-dimensional gel, they are not identified. It is now possible to identify proteins by coupling two-dimensional gel electrophoresis with mass spectrometry, a highly sensitive technique for the determination of the precise mass of the proteins in a given sample.

Figure 5.12: Alterations in protein levels detected by two-dimensional gel electrophoresis. Samples of (A) normal colon mucosa and (B) colorectal tumor tissue from the same person were analyzed by two-dimensional gel electrophoresis. In the gel section shown, changes in the intensity of several spots are evident, including a dramatic increase in levels of the protein indicated by the arrow, corresponding to the enzyme glyceraldehyde-3-phosphate dehydrogenase.

77

A Purification Scheme Can Be Quantitatively EvaluatedSome combination of purification techniques will usually yield a pure protein. To determine the success of a protein-purification scheme, we monitor the procedure at each step by determining specific activity and by performing an SDS-PAGE analysis. Consider the results for the purification of a hypothetical protein, summarized in Table 5.1 and Figure 5.13. At each step, the following parameters are measured:

Table 5.1 Quantification of a purification protocol for a hypothetical protein
Figure 5.13: Electrophoretic analysis of a protein purification. The purification scheme in Table 5.1 was analyzed by SDS-PAGE. Each lane contained 50 μg of sample. The effectiveness of the purification can be seen as the band for the protein of interest becomes more prominent relative to other bands.

As we see in Table 5.1, several purification steps can lead to several thousandfold purification. Inevitably, in each purification step, some of the protein of interest is lost, and so our overall yield is 35%. A good purification scheme takes into account purification levels as well as yield.

!quickquiz! QUICK QUIZ 2

What physical differences among proteins allow for their purification?

The SDS-PAGE depicted in Figure 5.13 shows that, if we load the same amount of protein onto each lane after each step, the number of bands decreases in proportion to the level of purification and the amount of protein of interest increases as a proportion of the total protein present.