Global Change
The expression global change entered the world’s vocabulary when it became clear that emissions from fossil-fuel burning and other human activities were beginning to alter the chemistry of the atmosphere. People are becoming increasingly concerned about the anthropogenic changes that have been observed in every component of the climate system. This section will describe three of the most serious forms of anthropogenic global change:
 Global warming due to increased concentrations of carbon dioxide and other greenhouse gases in the atmosphere
-
Ocean acidification due to increased carbon dioxide dissolved in the hydrosphere
-
Losses of species diversity due to changes in the biosphere
The consequences of anthropogenic global change are motivating politicians to work together in ways they never have before as we all try to avoid the “tragedy of the commons”: the spoiling of our commonly held environmental resources by overexploitation. Neighboring nations are enacting mutually beneficial regulations to address regional environmental problems, and new multinational treaties are being formulated in attempts to manage anthropogenic effects on the global environment. Earth science provides the knowledge needed to make rational choices about global environmental management.
Greenhouse Gases and Global Warming
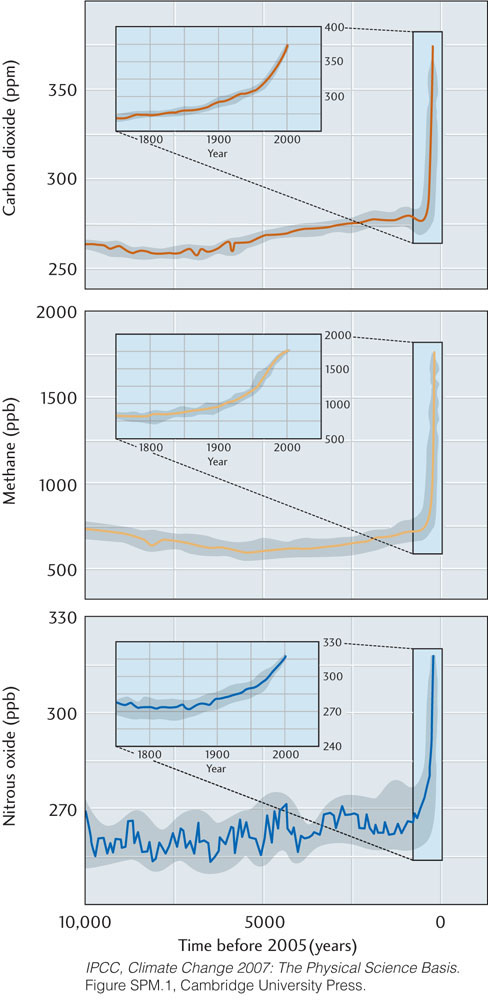
Since the beginning of the industrial era, fossil-fuel burning, deforestation, land-use changes, and other human activities have caused a significant rise in the concentrations of greenhouse gases in the atmosphere. Figure 23.26 shows the atmospheric concentrations of three greenhouse gases—carbon dioxide, methane, and nitrous oxide—over the past 10,000 years. In all three cases, the concentrations remained relatively constant through most of the Holocene, but shot upward after the industrial revolution.
661
The global atmospheric concentration of methane has increased by 150 percent from its preindustrial value, and that of carbon dioxide has increased 48 percent. In both cases, the observed increases can be explained by human activities, predominantly agriculture and fossil-fuel use. Methane’s greenhouse effect is weaker than that of carbon dioxide, however, so even though its relative concentration has gone up more, its contribution to greenhouse warming is only about 30 percent as large. The postindustrial increase in nitrous oxide, primarily from agriculture, has been about 20 percent, contributing only a small fraction to greenhouse warming.
These increases in greenhouse gas concentrations have been accompanied by a rise in average temperatures at Earth’s surface (see Figure 15.21). The United Nations, recognizing the potential problems this warming trend poses, established an Intergovernmental Panel on Climate Change (IPCC) in 1988 to assess the likelihood of anthropogenic climate change, its potential effects, and possible solutions to those problems (see Earth Issues 15.2). The IPCC provides a continuing forum for hundreds of scientists, economists, and policy experts to work together to understand these issues.
In its major assessment reports, the latest of which was released in 2013, the IPCC drew the following conclusions:
-
From the beginning of the twentieth century until 2012, the average temperature of Earth’s surface has risen, on average, by about 0.9°C.
-
Most of this warming has been caused by anthropogenic increases in atmospheric greenhouse gas concentrations.
-
Concentrations of atmospheric greenhouse gases will continue to increase throughout the twenty-first century, primarily because of human activities.
-
The increase in atmospheric greenhouse gas concentrations will cause significant global warming during the twenty-first century.
Predictions of Future Global Warming
The warming trend described in Chapter 15 has continued into the twenty-first century. The decade 2001–2010 was the warmest recorded since accurate temperature measurements began in 1880. The warmest year on record was 2010, followed by 2005. All ten of the warmest years have occurred since 1997.
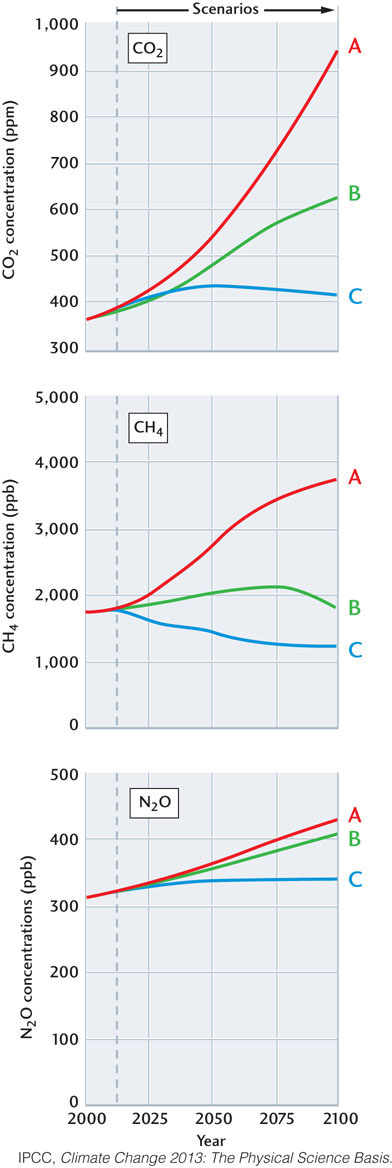
How much hotter will the planet get, and how will the global warming affect local climates? Answering such questions requires predictions based on complex models of the Earth system. The predictions are uncertain because they depend strongly on how human population and the global economy will evolve, including how energy supplies will be exploited and what political decisions will be made (if any) to limit greenhouse gas emissions. The IPCC has forecast increases in atmospheric CO2 concentrations under a series of scenarios that sample the possibilities. Each scenario is characterized by a representative concentration pathway or RCP that corresponds to a net concentration of greenhouse gases in Earth’s atmosphere by the year 2100. Three of these scenarios are depicted in Figure 23.27:
-
Scenario A assumes a continued reliance on fossil fuels as our major energy source and thus an increasing concentration of greenhouse gases, as given by the red lines in Figure 23.27. In this scenario, called “RPC8.5” by the IPCC, the carbon dioxide concentration would top 900 ppm by 2100, more than three times its preindustrial level.
-
Scenario B (green line, “RCP6”) assumes that carbon dioxide concentrations will begin to stabilize in the later part of the twenty-first century, reaching just over 600 ppm, more than twice the preindustrial level, by 2100. This scenario would require a big shift toward fossil fuels with less carbon intensity, such as natural gas, as well as an increasing reliance on nuclear energy and renewable energy sources.
-
Scenario C (blue line, “RCP2.6”) has a peak in carbon dioxide concentrations around 2050, followed by a modest decline to carbon dioxide concentrations near the present level (400 ppm) by the end of the century. This scenario would require a much more rapid conversion from fossil fuels to cleaner alternatives.
Here we can add that the scenarios for global population growth shown in Figure 23.1 were developed by the IPCC to be consistent with the three RCPs listed above. For example, scenario C corresponds to a declining world population in 2100.
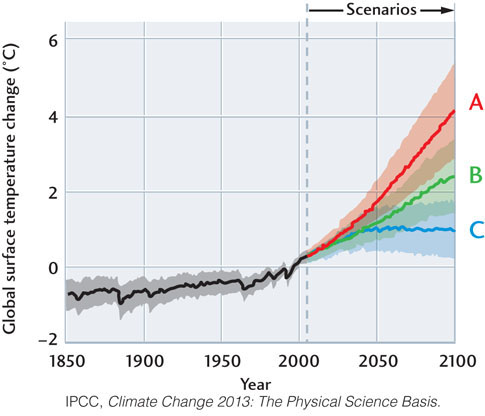
The IPCC has used these scenarios to predict average global surface temperatures (Figure 23.28). Allowing for uncertainties in the Earth system models, it found that the possible range of global temperature increases during the twenty-first century could range from about 0.5°C to 5.5°C. The lower values can be achieved only through rapid reductions in fossil-fuel burning and conversion to clean and resource-efficient energy technologies. Under the less radical (but still optimistic) scenario B, the temperature rise by 2100 would likely exceed 2ºC, over twice the twentieth-century warming. In scenario A, the most pessimistic, the temperature increase would probably exceed 4ºC.
662
Consequences of Climate Change
It seems clear that human emissions of greenhouse gases will cause further global warming and may result in major changes to the climate system. These changes have the potential to affect civilization in both positive and negative ways. Some regional climates may improve while others may deteriorate. The authors’ home city of Los Angeles, for example, is likely to become hotter and drier. Some potential effects of climate change are listed in Table 23.1.
| System | Potential Effects |
|---|---|
| Forests and other ecosystems | Migration of vegetation; reduction in ecosystem ranges; altered ecosystem composition |
| Species diversity | Loss of diversity; migration of species; invasion of new species |
| Coastal wetlands | Inundation of wetlands; migration of wetland vegetation |
| Aquatic ecosystems | Loss of habitat; migration to new habitats; invasion of new species |
| Coastal resources | Inundation of coastal structures; increased risk of flooding |
| Water resources | Changes in water supplies; changes in patterns of drought and flooding; changes in water quality |
| Agriculture | Changes in crop yields; shifts in relative productivity among regions |
| Human health | Shifts in ranges of infectious disease organisms; changes in patterns of heat-stress and cold-weather afflictions |
| Energy | Increase in cooling demand; decrease in heating demand; changes in hydroelectric energy resources |
Source: Office of Technology Assessment, U.S. Congress.
Changes in Regional Weather Patterns
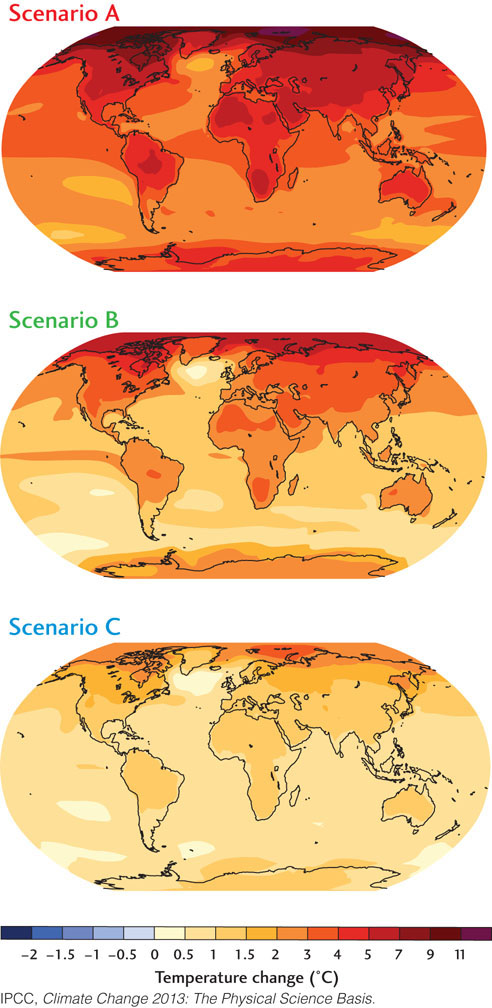
How will the enhanced greenhouse effect, along with other factors, such as deforestation, change temperatures across Earth’s surface? Figure 23.29 maps the regional temperature increases predicted by the three IPCC scenarios. The predicted geographic patterns of temperature change display some similarities to the observed pattern of late-twentieth-century warming in Figure 15.21. In particular, the warming is greater over land than over the oceans, and the temperate and polar regions of the Northern Hemisphere show the most warming. Thus, geographic patterns of climate change in the twenty-first century are likely to be similar to those observed over the past several decades.
The IPCC has documented a number of current trends in regional weather patterns that are likely to continue:
-
The relative humidity and frequency of heavy precipitation events have increased over many land areas in a manner consistent with the observed temperature increases. Increased precipitation has been observed in eastern parts of North and South America, northern Europe, and northern and central Asia.
-
Drying has been observed in the Sahel, the Mediterranean, southern Africa, and parts of southern Asia. More intense and longer droughts have been observed over wider areas since the 1970s, particularly in the tropics and subtropics.
-
Widespread changes in temperature extremes have been observed over the last 50 years. Cold days, cold nights, and frost have become less frequent, while hot days, hot nights, and heat waves have become more frequent.
-
Intense hurricane activity in the North Atlantic has increased in a manner consistent with increases in tropical sea surface temperatures. Although there is no clear trend in the annual number of hurricanes, the number of very strong hurricanes (category 4 and 5 storms) has almost doubled over the past three decades.
664
Changes in The Cryosphere
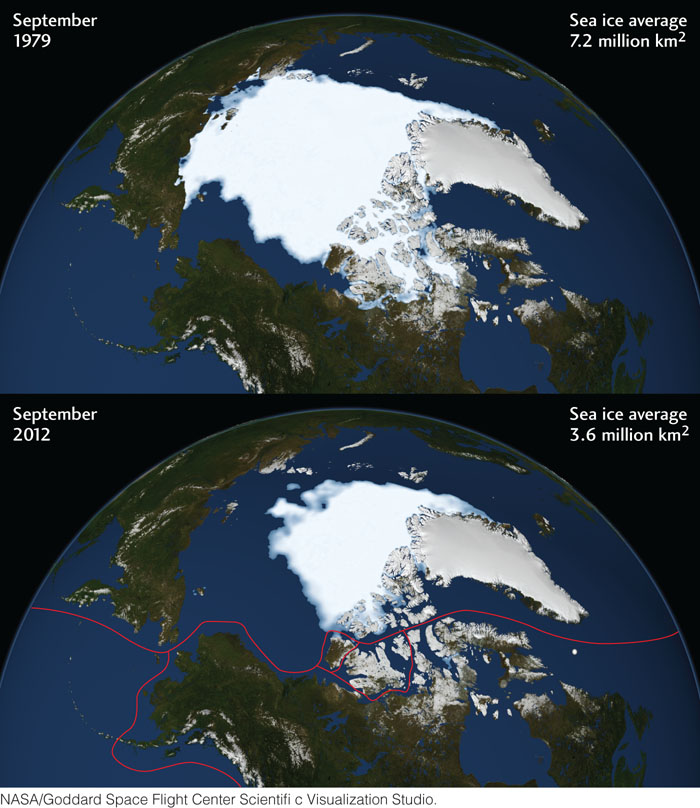
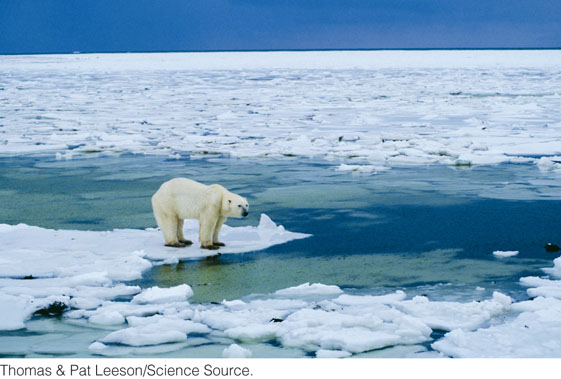
Nowhere are the effects of global warming more evident than in polar regions. The amount of sea ice in the Arctic Ocean is decreasing, and the downward trend seems to be accelerating. The sea ice cover in September 2012 was the lowest for that month since the keeping of satellite records began in 1978: 3.6 million square kilometers, down by a factor of two from the 1979 minimum of 7.2 million square kilometers (Figure 23.30). According to climate models, much of the Arctic Ocean will become ice-free within a few decades. The shrinkage of sea ice is already severely disrupting Arctic ecosystems (Figure 23.31).
Temperatures at the top of the permafrost layer in the Arctic have risen by 3°C since the 1980s, and the melting of permafrost is destabilizing structures such as the Trans-Alaska oil pipeline (see Figure 21.20). The maximum area covered by seasonally frozen ground has decreased by about 7 percent in the Northern Hemisphere since 1900, with a decrease in spring of up to 15 percent. Valley glaciers at lower latitudes retreated during the twentieth-century warming (see Figure 21.9). Fieldwork has demonstrated that rates of glacial retreat and snow cover loss are increasing in both hemispheres. According to a study by the USGS, Glacier National Park in northern Montana will lose its large glaciers by 2030.
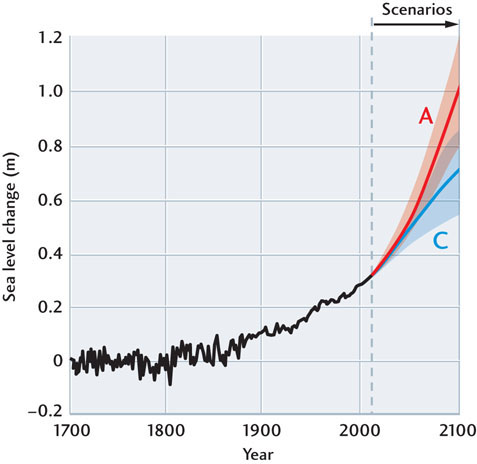
Sea Level Rise
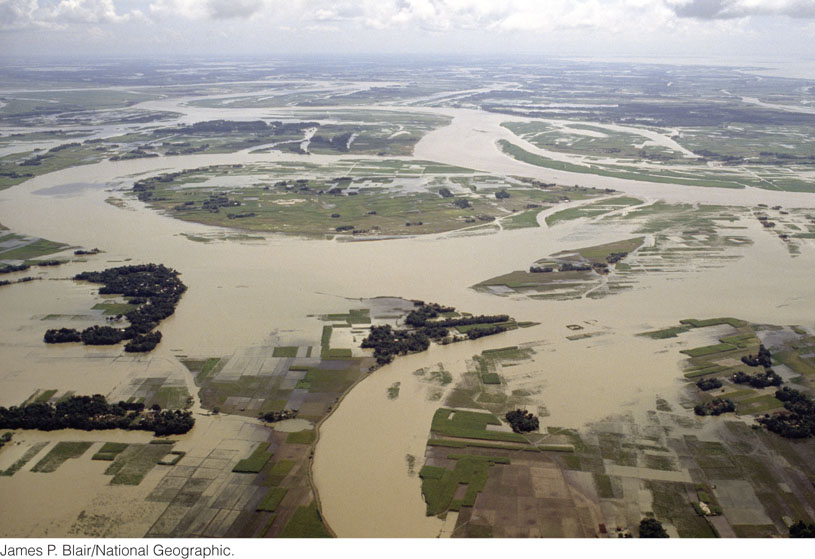
As we saw in Chapter 21, the melting of sea ice does not affect sea level, but the melting of continental glaciers causes sea level to rise. Sea level also rises as the temperature of ocean water increases, increasing its overall volume by a tiny fraction (see Chapter 21, Practicing Geology). Sea level has risen more than 2 m since the industrial revolution, and it is currently rising at about 3 mm per year. Climate models based on the IPCC scenarios indicate that sea level could rise by as much as a meter during the twenty-first century (Figure 23.32), creating serious problems for low-lying countries such as Bangladesh (Figure 23.33). On the Eastern Seaboard and Gulf Coast of the United States, flooding during coastal storm surges, such as that witnessed in Hurricanes Katrina and Sandy (see Chapter 20), could become much worse.
665
Species and Ecosystem Migration
As local and regional climates change, ecosystems will change with them. Many plant and animal species will have difficulty adjusting to rapid climate change or migrating to more suitable climates. Those that cannot cope with the rapid warming could become extinct. Global warming is already being blamed for a variety of adverse ecological effects, such as the disruption of Arctic ecosystems as sea ice and permafrost melt and the spread of tropical diseases like malaria as more of the world experiences a tropical climate.
The Potential for Catastrophic Changes to The Climate System
The current atmospheric concentrations of carbon dioxide and methane far exceed anything seen in the last 650,000 years. Our climate system is therefore entering unknown territory. Some observers think that the credibility of climate change projections suffers from “the Chicken Little problem”: too many people are running around yelling “The sky is falling!” Yet most scientists think that those projections may be too conservative because they do not properly take into account some of the positive feedbacks within the climate system that could greatly enhance global change. Ocean acidification, mentioned earlier in this chapter, is a good example. Here are a few more:
-
Destabilization of continental glaciers. The surface melting of the Greenland glacier in 2012 was the largest on record, and there are indications that glacial streams within the ice sheet are accelerating much faster than expected. If the Greenland and Antarctic glaciers begin to shed ice faster than snowfall can generate new glacial ice, sea level could begin to rise much faster than the current IPCC predictions.
-
Shutoff of thermohaline circulation. Changes in precipitation and evaporation patterns are decreasing the salinity of seawater at mid- and high latitudes. Some scientists have speculated that this change could substantially reduce global thermohaline circulation (see Figure 15.3b), which is driven by differences in temperature and salinity. Major changes in the Gulf Stream and other aspects of the climate system could result.
-
Methane release from seafloor sediments and permafrost. Recall from Chapter 11 that a massive release of methane from shallow seafloor sediments about 55 million years ago might have caused abrupt global warming and led to the mass extinction at the Paleocene-Eocene boundary. Today, there is far more methane stored in shallow seafloor sediments and in permafrost than was released at the end of the Paleocene. If global warming begins to thaw those methane deposits, another runaway cycle of extreme warming could begin.
666
Ocean Acidification
As we saw in Chapter 15, about 30 percent of the carbon dioxide emitted into the atmosphere by fossil-fuel combustion is being absorbed by the oceans (see Figure 15.19). Scientists are concerned that the resulting increase in seawater acidity (see Figure 15.15) could decrease the calcification processes underlying the growth of shellfish and the formation of the hard exterior skeletons of corals.
In January 2009, 155 marine scientists from 26 countries, convened under the auspices of the United Nations, issued the Monaco Declaration, which states, “We are deeply concerned by recent, rapid changes in ocean chemistry and their potential, within decades, to severely affect marine organisms.… Severe damages are imminent.” The scientists pointed specifically to observations of acidification-related decreases in shellfish weights and slowed growth of coral reefs.
Ocean acidification is likely to affect many types of marine organisms, not just those with calcium carbonate shells and skeletons. Anemones and jellyfish, for example, appear to be susceptible to even small changes in seawater acidity, and larger increases cause changes in seawater chemistry that can undermine the health of sea urchins and squid. The growing acidity of ocean surface waters is also likely to affect the concentrations of trace metals such as iron, an essential nutrient for the growth of many organisms.
As human activities continue to pump more CO2 into the atmosphere, the ocean will continue to acidify. Whether marine organisms can adapt to the changes in store remains to be seen, but the effects on human society could be substantial. In the short term, damage to coral reef ecosystems and the fisheries and recreation industries that depend on them could result in economic losses amounting to many billions of dollars per year. In the longer term, changes in the stability of coastal reefs may reduce the protection they offer to coasts, and there may also be direct and indirect effects on commercially important fish and shellfish species.
Ocean acidification is essentially irreversible during our lifetimes. Even if we were magically able to reduce the atmospheric concentration of CO2 to the level of 200 years ago, it would take tens of thousands of years for ocean chemistry to return to the conditions that existed at that time.
Loss of Biodiversity
In 2003, atmospheric chemist and Nobel laureate Paul Crutzen proposed the recognition of a new geologic epoch—the Anthropocene, or Age of Man—beginning about 1780, when James Watt’s coal-powered steam engine launched the industrial revolution. The global changes that mark the Holocene-Anthropocene boundary are just now getting under way, so a future scientist with a full record of the next few thousand years may place that boundary at a somewhat later date. Crutzen’s main point, however, is that global changes are proceeding so rapidly that such quibbles are likely to be minor. As with many previous geologic boundaries, the main marker will be a mass extinction.
667
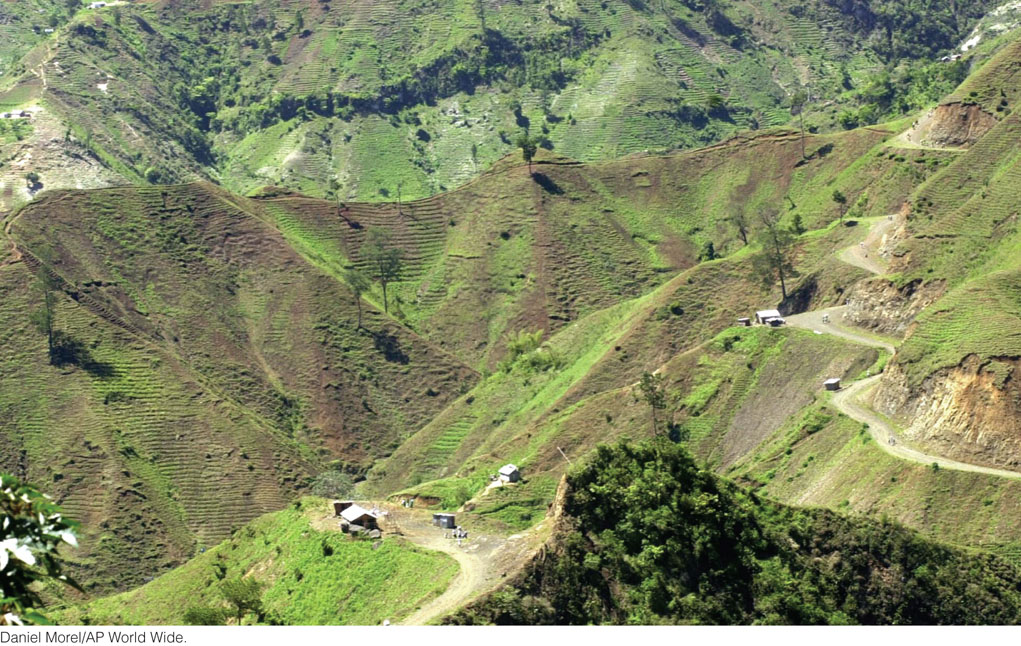
Between 1850 and 1880, as much as 15 percent of the land surface was deforested, and rates of deforestation have continued to rise. According to the United Nations, over 150,000 km2 of tropical rain forests—about 1 percent of the total resource—are being converted each year to other land uses, mostly agricultural ones. In 1950, forests covered approximately 25 percent of Haiti (a Caribbean island country the size of Maryland); its forested area now stands at less than 2 percent (Figure 23.34). Other developing nations face similar problems.
Given these rates of habitat loss, it is not surprising that the number of extant species—the most important measure of biodiversity—is declining. Biologists estimate that there are over 10 million different species alive on the planet today, although only 1.5 million have been officially classified. Extinction rates are difficult to quantify, but most knowledgeable scientists believe that up to one-fifth of all species will disappear during the next 30 years, and that as many as one-half may go extinct during the twenty-first century. One respected biologist, Peter Raven, has put the problem bluntly:
We are confronting an episode of species extinction greater than anything the world has experienced for the past 65 million years. Of all the global problems that confront us, this is the one that is moving the most rapidly and the one that will have the most serious consequences. And, unlike other global ecological problems, it is completely irreversible.
Some observers, such as sociobiologist E. O. Wilson, have gone so far as to call the current rapid worldwide decline in biodiversity the “Sixth Extinction,” placing it in the same rank as the “Big Five” mass extinctions of the Phanerozoic eon (see Figure 11.17). Others consider this extrapolation to be premature, however, because even the rapid losses in biodiversity we see today will not necessarily affect the fossil record as profoundly as, say, the mass extinction at the end of the Cretaceous period, or even the less severe mass extinction associated with global warming at the Paleocene-Eocene boundary.