17-5 The spectra of stars reveal their chemical compositions as well as their surface temperatures
We have seen how the color of a star’s light helps astronomers determine its surface temperature. To determine the other properties of a star, astronomers must analyze the spectrum of its light in more detail. This technique of stellar spectroscopy began in 1817 when Joseph Fraunhofer, a German instrument maker, attached a spectroscope to a telescope and pointed it toward the stars. Fraunhofer had earlier observed that the Sun has an absorption line spectrum—that is, a continuous spectrum with dark absorption lines (see Section 5-6). He found that stars have the same kind of spectra, which reinforces the idea that our Sun is a rather typical star. But Fraunhofer also found that the pattern of absorption lines is different for different stars.
Classifying Stars: Absorption Line Spectra and Spectral Classes
We see an absorption line spectrum when a cool gas lies between us and a hot, glowing object (recall Figure 5-17). The light from the hot, glowing object itself has a continuous spectrum. In the case of a star, light with a continuous spectrum is produced at low-lying levels of the star’s atmosphere where the gases are hot and dense. The absorption lines are created when this light flows outward through the upper layers of the star’s atmosphere. Atoms in these cooler, less dense layers absorb radiation at specific wavelengths, which depend on the specific kinds of atoms present—hydrogen, helium, or other elements—and on whether or not the atoms are ionized. Absorption lines in the Sun’s spectrum are produced in this same way (see Section 16-5).
Some stars have spectra in which the Balmer absorption lines of hydrogen are prominent. But in the spectra of other stars, including the Sun, the Balmer lines are nearly absent and the dominant absorption lines are those of heavier elements such as calcium, iron, and sodium. Still other stellar spectra are dominated by broad absorption lines caused by molecules, such as titanium oxide, rather than single atoms. To cope with this diversity, astronomers group similar-appearing stellar spectra into spectral classes. In a popular classification scheme that emerged in the late 1890s, a star was assigned a letter from A through O according to the strength or weakness of the hydrogen Balmer lines in the star’s spectrum.
Deciphering the information in starlight took the painstaking work of generations of astronomers
Nineteenth-century science could not explain why or how the spectral lines of a particular chemical are affected by the temperature and density of the gas. Nevertheless, a team of astronomers at the Harvard College Observatory forged ahead with a monumental project of examining the spectra of hundreds of thousands of stars. Their goal was to develop a system of spectral classification in which all spectral features, not just Balmer lines, change smoothly from one spectral class to the next.
The Harvard project was financed by the estate of Henry Draper, a wealthy New York physician and amateur astronomer who in 1872 became the first person to photograph stellar absorption lines. Researchers on the project included Edward C. Pickering, Williamina Fleming, Antonia Maury, and Annie Jump Cannon (Figure 17-10). As a result of their efforts, many of the original A-through-O classes were dropped and others were consolidated. The remaining spectral classes were reordered in the sequence OBAFGKM. You can remember this sequence with the mnemonic “Oh, Be A Fine Girl (or Guy), Kiss Me!”
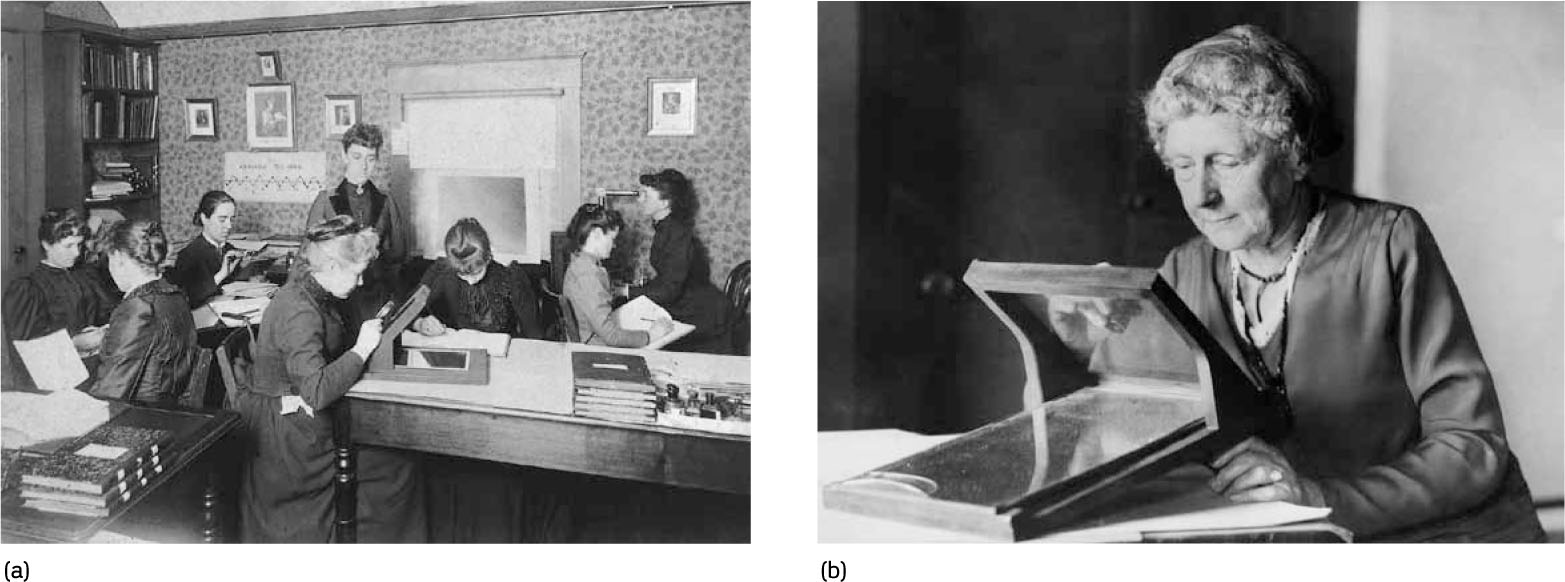
Classifying the Spectra of the Stars The modern classification scheme for stars, based on their spectra, was developed at the Harvard College Observatory in the late nineteenth century. Female astronomers, initially led by Edward C. Pickering (not shown) and (a) Williamina Fleming, standing, and then by (b) Annie Jump Cannon, analyzed hundreds of thousands of spectra. Social conventions of the time prevented most female astronomers from using research telescopes or receiving salaries comparable to those of men.
CONCEPT CHECK 17-7
What principal characteristic of a star’s spectrum most dominates which spectral class letter of the alphabet it is assigned?
The prominence of certain hydrogen absorption lines visible in the star, with A class being the greatest and O class being the least.
Refining the Classification: Spectral Types
Cannon refined the original OBAFGKM sequence into smaller steps called spectral types. These steps are indicated by attaching an integer from 0 through 9 to the original letter. For example, the spectral class F includes spectral types F0, F1, F2, …, F8, F9, which are followed by the spectral types G0, G1, G2, …, G8, G9, and so on.
Figure 17-11 shows representative spectra of several spectral types. The strengths of spectral lines change gradually from one spectral type to the next. For example, the Balmer absorption lines of hydrogen become increasingly prominent as you go from spectral type B0 to A0. From A0 onward through the F and G classes, the hydrogen lines weaken and almost fade from view. The Sun, whose spectrum is dominated by calcium and iron, is a G2 star.
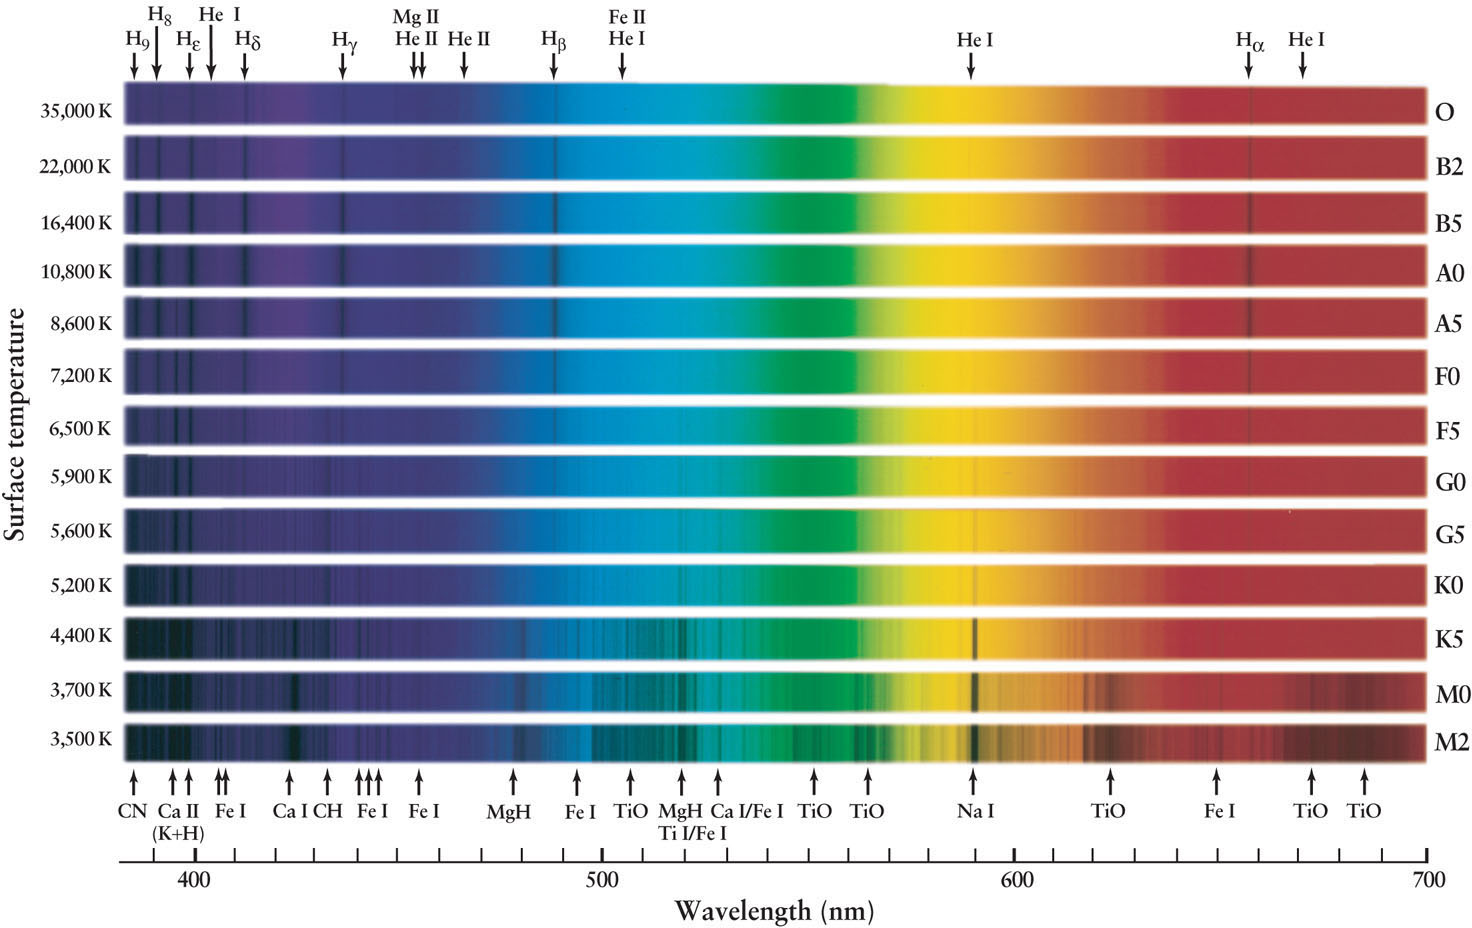
Principal Types of Stellar Spectra Stars of different spectral classes and different surface temperatures have spectra dominated by different absorption lines. Notice how the Balmer lines of hydrogen (Hα, Hβ, Hγ, and Hδ) are strongest for hot stars of spectral class A, while absorption lines due to calcium (Ca) are strongest in cooler K and M stars. The spectra of M stars also have broad, dark bands caused by molecules of titanium oxide (TiO), which can only exist at relatively low temperatures. A roman numeral after a chemical symbol shows whether the absorption line is caused by un-ionized atoms (roman numeral I) or by atoms that have lost one electron (roman numeral II). The Sun, a G2 star, has a spectrum between G0 and G5.
The Harvard project culminated in the Henry Draper Catalogue, published between 1918 and 1924. It listed 225,300 stars, each of which Cannon had personally classified. Meanwhile, physicists had been making important discoveries about the structure of atoms. Ernest Rutherford had shown that atoms have nuclei (recall Figure 5-20), and Niels Bohr made the remarkable hypothesis that electrons circle atomic nuclei along discrete orbits (see Figure 5-22). These advances gave scientists the conceptual and mathematical tools needed to understand stellar spectra.
In the 1920s, the Harvard astronomer Cecilia Payne and the Indian physicist Meghnad Saha demonstrated that the OBAFGKM spectral sequence is actually a sequence in temperature. The hottest stars are O stars. Their absorption lines can occur only if these stars have surface temperatures above 25,000 K. M stars are the coolest stars. The spectral features of M stars are consistent with stellar surface temperatures of about 3000 K.
CONCEPT CHECK 17-8
Is a spectral class F2 star more similar to an A-spectral class star or a G-spectral class star?
In the sequence OBAFGKM, F-spectral class stars with designations F1, F2, F3, and F4 are more similar to A-spectral class stars, and F6, F7, F8, and F9 are more similar to G-spectral class stars.
CONCEPT CHECK 17-9
As spectral type numbers increase within the G-spectral class of stars, do the larger numbers represent higher temperature stars?
No. Within a particular spectral class, the larger numbers correspond to cooler stars. For example, a G2 star is hotter than a G8 star because a G2 is closer to the hotter F-spectral class stars in the sequence OBAFGKM.
Why Surface Temperature Affects Stellar Spectra
To see why the appearance of a star’s spectrum is profoundly affected by the star’s surface temperature, consider the Balmer lines of hydrogen. Hydrogen is by far the most abundant element in the universe, accounting for about three-quarters of the mass of a typical star. Yet the Balmer lines do not necessarily show up in a star’s spectrum. As we saw in Section 5-8, Balmer absorption lines are produced when an electron in the n = 2 orbit of hydrogen is lifted into a higher orbit by absorbing a photon with the right amount of energy (see Figure 5-24). If the star is much hotter than 10,000 K, the photons pouring out of the star’s interior have such high energy that they easily knock electrons out of hydrogen atoms in the star’s atmosphere. This process ionizes the gas. With its only electron torn away, a hydrogen atom cannot produce absorption lines. Hence, the Balmer lines will be relatively weak in the spectra of such hot stars, such as the hot O and B2 stars in Figure 17-11.
Conversely, if the star’s atmosphere is much cooler than 10,000 K, almost all the hydrogen atoms are in the lowest (n = 1) energy state. Most of the photons passing through the star’s atmosphere possess too little energy to boost electrons up from the n = 1 to the n = 2 orbit of the hydrogen atoms. Hence, very few of these atoms will have electrons in the n = 2 orbit, and only these few can absorb the photons characteristic of the Balmer lines. As a result, these lines are nearly absent from the spectrum of a cool star. (You can see this in the spectra of the cool M0 and M2 stars in Figure 17-11.)
For the Balmer lines to be prominent in a star’s spectrum, the star must be hot enough to excite the electrons out of the ground state but not so hot that all the hydrogen atoms become ionized. A stellar surface temperature of about 9000 K produces the strongest hydrogen lines; this is the case for the stars of spectral types A0 and A5 in Figure 17-11.
 Every other type of atom or molecule also has a characteristic temperature range in which it produces prominent absorption lines in the observable part of the spectrum. Figure 17-12 shows the relative strengths of absorption lines produced by different chemicals. By measuring the details of these lines in a given star’s spectrum, astronomers can accurately determine that star’s surface temperature.
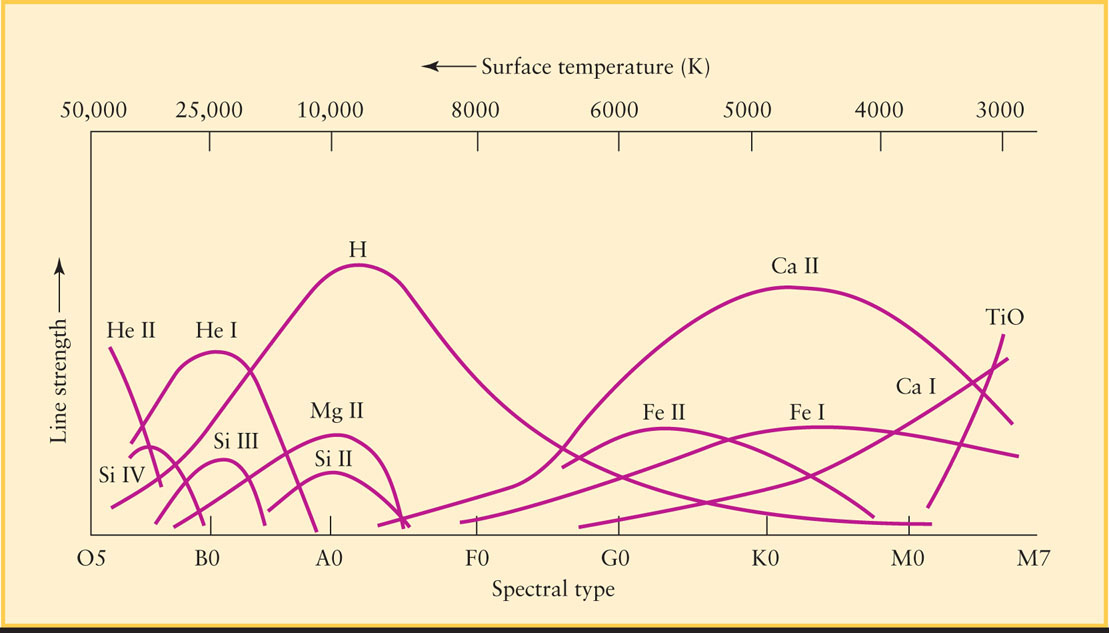
For example, the spectral lines of neutral (that is, un-ionized) helium are strong around 25,000 K. At this temperature, photons have enough energy to excite helium atoms without tearing away the electrons altogether. In stars hotter than about 30,000 K, helium atoms become singly ionized, that is, they lose one of their two electrons. The remaining electron produces a set of spectral lines that is recognizably different from those of neutral helium. Hence, when the spectral lines of singly ionized helium appear in a star’s spectrum, we know that the star’s surface temperature is greater than 30,000 K.
Astronomers use the term metals to refer to all elements other than hydrogen and helium. This idiosyncratic use of the term “metal” is quite different from the definition used by chemists and other scientists. To a chemist, sodium and iron are metals but carbon and oxygen are not; to an astronomer, all of these substances are metals. In this terminology, metals dominate the spectra of stars cooler than 10,000 K. Ionized metals are prominent for surface temperatures between 6000 and 8000 K, while neutral metals are strongest between approximately 5500 and 4000 K.
Below 4000 K, certain atoms in a star’s atmosphere combine to form molecules. (At higher temperatures atoms move so fast that when they collide, they bounce off each other rather than “sticking together” to form molecules.) As these molecules vibrate and rotate, they produce bands of spectral lines that dominate the star’s spectrum. Most noticeable are the lines of titanium oxide (TiO), which are strongest for surface temperatures of about 3000 K.
Spectral Classes for Brown Dwarfs
Since 1995 astronomers have found a number of stars with surface temperatures even lower than those of spectral class M. Strictly speaking, these are not stars but brown dwarfs. Brown dwarfs are too small to sustain thermonuclear fusion in their cores; they have masses between 13 MJ and 80 MJ (where MJ stands for mass of Jupiter). Instead, these “substars” glow primarily from the heat released by Kelvin-Helmholtz contraction. This is the process where gravitational contraction compresses and heats up gas, which we described in Section 16-1. (They do undergo fusion reactions for a brief period during their evolution.) Brown dwarfs are so cold that they are best observed with infrared telescopes (Figure 17-13). Such observations reveal that brown dwarf spectra have a rich variety of absorption lines due to molecules. Some of these molecules actually form into solid grains in a brown dwarf’s atmosphere.
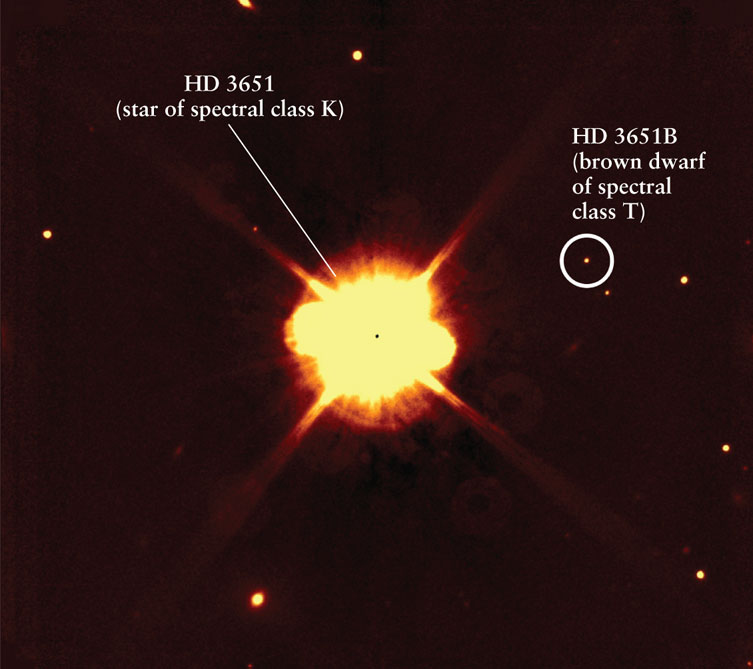
An Infrared Image of Brown Dwarf HD 3651B The star HD 3561 is of spectral class K, with a surface temperature of about 5200 K. (“HD” refers to the Henry Draper Catalogue.) In 2006 it was discovered that HD 3651 is orbited by a brown dwarf named HD 3651B with a surface temperature between 800 and 900 K and a luminosity just 1/300,000 that of the Sun. The brown dwarf emits most of its light at infrared wavelengths, so an infrared telescope was used to record this image. The hotter and more luminous star HD 3651 is greatly overexposed in this image and appears much larger than its true size. HD 3651 and HD 3651B are both 11 pc (36 ly) from Earth in the constellation Pisces (the Fish); the other stars in this image are much farther away.
To describe brown dwarf spectra, astronomers have defined three new spectral classes, L, T, and Y, with the Y class for brown dwarfs below temperatures of 600 K. Thus, the modern spectral sequence of stars and brown dwarfs from hottest to coldest surface temperature is OBAFGKMLTY. (Can you think of a new mnemonic that includes L, T, and Y?) For example, Figure 17-13 shows a star of spectral class K and a brown dwarf of spectral class T. Table 17-2 summarizes the relationship between the temperature and spectra of stars and brown dwarfs.
| Spectral class | Color | Temperature (K) | Spectral lines | Examples |
|---|---|---|---|---|
| O | Blue-violet | 30,000–50,000 | Ionized atoms, especially helium | Naos (ζ Puppis), Mintaka (δ Orionis) |
| B | Blue-white | 11,000–30,000 | Neutral helium, some hydrogen | Spica (α Virginis), Rigel (β Orionis) |
| A | White | 7500–11,000 | Strong hydrogen, some ionized metals | Sirius (α Canis Majoris), Vega (α Lyrae) |
| F | Yellow-white | 5900–7500 | Hydrogen and ionized metals such as calcium and iron | Canopus (α Carinae), Procyon (α Canis Minoris) |
| G | Yellow | 5200–5900 | Both neutral and ionized metals, especially ionized calcium | Sun, Capella (α Aurigae) |
| K | Orange | 3900–5200 | Neutral metals | Arcturus (α Boötis), Aldebaran (α Tauri) |
| M | Red-orange | 2500–3900 | Strong titanium oxide and some neutral calcium | Antares (α Scorpii), Betelgeuse (α Orionis) |
| L | Red | 1300–2500 | Neutral potassium, rubidium, and cesium, and metal hydrides | Brown dwarf Teide 1 |
| T | Red | 700–1300 | Methane, strong neutral potassium and some water (H2O) | Brown dwarfs Gliese 229B, HD 3651B |
| Y | Red | below 600 | Possibly ammonia | Brown dwarfs CFBDS J005910.90–011401.3, WISE 1828+2650 |
NASA’s Wide-field Infrared Satellite (WISE) telescope discovered more than 100 new brown dwarfs. The coolest known brown dwarf is a mere 80°F, which is about room temperature. Early predictions suggested that there might be twice as many brown dwarfs as regular stars, but observations are finding a much smaller ratio—about one brown dwarf for every six regular stars.
All Stars Have Similar Composition
When the effects of temperature are accounted for, astronomers find that all stars have essentially the same chemical composition. We can state the results as a general rule:
By mass, almost all stars and brown dwarfs are about three-quarters hydrogen, one-quarter helium, and 1% or less metals (elements heavier than helium).
Our Sun is no exception: It is about 75% hydrogen with the remainder consisting mostly of helium and about 1.7% heavier elements. As we discuss next, while the composition of most stars is similar, their sizes and temperatures can be quite different.
CONCEPT CHECK 17-10
Which is hotter, an L brown dwarf or a T brown dwarf?
Given that the modern spectral sequence of stars and brown dwarfs from hottest to coolest is OBAFGKMLT, L-spectral class brown dwarfs are hotter than T-spectral class brown dwarfs.
CONCEPT CHECK 17-11
Aside from surface temperature, what is the main difference between a regular star like our Sun and a brown dwarf?
Stars like our Sun derive their energy from nuclear reactions in the core, whereas brown dwarfs derive their energy from gravitational contraction. Brown dwarfs are not true stars.