The accuracy of phylogenetic methods can be tested
If phylogenetic trees represent reconstructions of past events, and if many of these events occurred before any humans were around to witness them, how can we test the accuracy of phylogenetic methods? Biologists have conducted experiments both in living organisms and with computer simulations that have demonstrated the effectiveness and accuracy of phylogenetic methods.
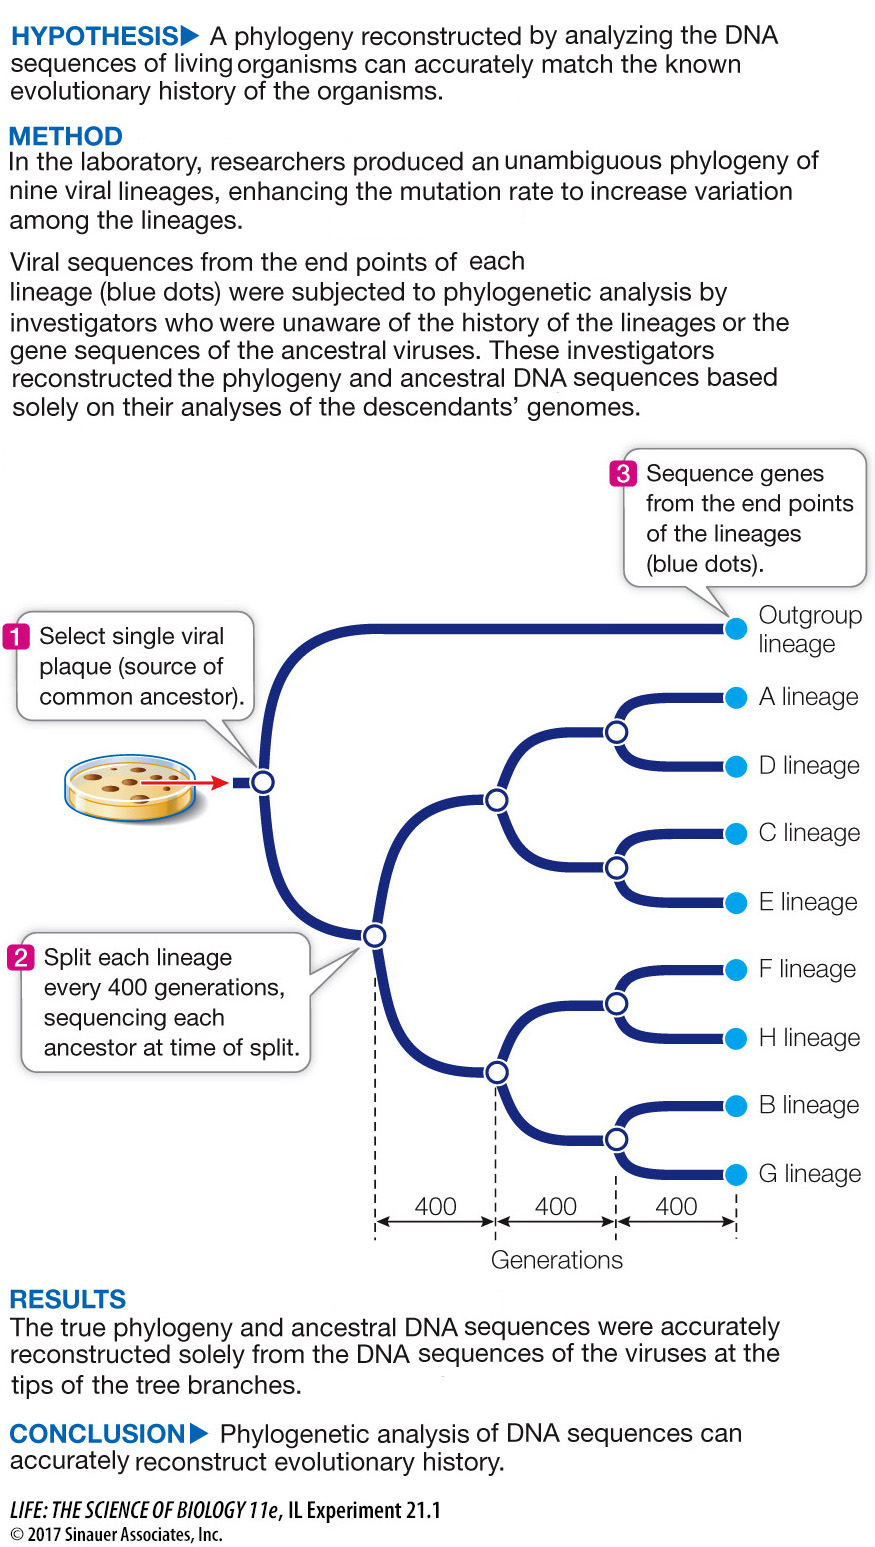
In one experiment designed to test the accuracy of phylogenetic analysis, a single viral culture of bacteriophage T7 was used as a starting point, and lineages were allowed to evolve from this ancestral virus in the laboratory (Investigating Life: Testing the Accuracy of Phylogenetic Analysis). The initial culture was split into two separate lineages, one of which became the ingroup for analysis and the other of which became the outgroup for rooting the tree. The lineages in the ingroup were split in two after every 400 generations, and samples of the virus were saved for analysis at each branching point. The lineages were allowed to evolve until there were eight lineages in the ingroup. Mutagens were added to the viral cultures to increase the mutation rate so that the amount of change and the degree of homoplasy would be typical of the organisms analyzed in average phylogenetic analyses. The investigators then sequenced samples from the end points of the eight ingroups and one outgroup lineages, as well as from the ancestors at the branching points. They then gave the sequences from the end points of the lineages to other investigators to analyze, without revealing the known history of the lineages or the sequences of the ancestral viruses.
After the phylogenetic analysis was completed, the investigators asked two questions. Did phylogenetic methods reconstruct the known history correctly? And were the sequences of the ancestral viruses reconstructed accurately? The answer in both cases was yes. The branching order of the lineages was reconstructed exactly as it had occurred, more than 98 percent of the nucleotide positions of the ancestral viruses were reconstructed correctly, and 100 percent of the amino acid changes in the viral proteins were reconstructed correctly.
The experiment shown in Investigating Life: Testing the Accuracy of Phylogenetic Analysis demonstrated that phylogenetic analysis was accurate under the conditions tested, but it did not examine all possible conditions. Other experimental studies have taken other factors into account, such as the sensitivity of phylogenetic analysis to convergent environments and highly variable rates of evolutionary change. In addition, computer simulations based on evolutionary models have been used extensively to study the effectiveness of phylogenetic analysis. These studies have also confirmed the accuracy of phylogenetic methods and have been used to refine those methods and extend them to new applications.
investigating life
Testing the Accuracy of Phylogenetic Analysis
experiment
Original Paper: Hillis, D. M., J. J. Bull, M. E. White, M. R. Badgett, and I. J. Molineux. 1992. Experimental phylogenetics: Generation of a known phylogeny. Science 255: 589–
To test whether analysis of gene sequences can accurately reconstruct evolutionary phylogeny, we must have an unambiguously known phylogeny to compare against the reconstruction. Will the observed phylogeny match the reconstruction?

Animation 21.1 Using Phylogenetic Analysis to Reconstruct Evolutionary History
work with the data
Original Paper: Bull, J. J., C. W. Cunningham, I. J. Molineux, M. R. Badgett, and D. M. Hillis. 1993. Experimental molecular evolution of bacteriophage T7. Evolution 47: 993–
The full DNA sequences for the viral lineages produced in this experiment are thousands of nucleotides long. However, 23 of the nucleotide positions are shown in the table below, and you can use these data to repeat the researchers’ analysis. Each nucleotide position represents a separate character.
QUESTIONS
| Character at position | |||||||||||||||||||||||
|---|---|---|---|---|---|---|---|---|---|---|---|---|---|---|---|---|---|---|---|---|---|---|---|
| Lineage | 1 | 2 | 3 | 4 | 5 | 6 | 7 | 8 | 9 | 10 | 11 | 12 | 13 | 14 | 15 | 16 | 17 | 18 | 19 | 20 | 21 | 22 | 23 |
| A | T | C | G | G | G | C | C | C | C | C | C | C | A | A | C | C | G | A | T | A | C | A | A |
| B | C | C | G | G | G | T | C | C | C | T | C | C | G | A | T | T | A | G | C | G | T | G | G |
| C | C | C | G | G | G | C | C | C | T | C | C | T | A | A | C | C | G | G | T | A | C | A | A |
| D | T | C | A | G | G | C | C | C | C | C | C | C | A | A | C | C | G | A | T | A | C | A | A |
| E | C | T | G | G | G | C | C | C | C | C | C | T | A | A | C | C | G | G | T | A | C | A | A |
| F | C | T | G | A | A | C | C | C | C | C | C | C | G | A | C | T | G | G | C | G | C | G | G |
| G | C | C | G | G | G | T | T | C | C | T | C | C | G | A | T | T | A | G | C | G | C | G | G |
| H | C | C | G | G | A | C | C | C | C | C | C | C | G | C | C | T | G | G | C | G | C | G | G |
| Outgroup | C | C | G | G | G | C | C | T | C | C | T | C | G | A | C | C | G | G | C | A | C | G | G |
1.
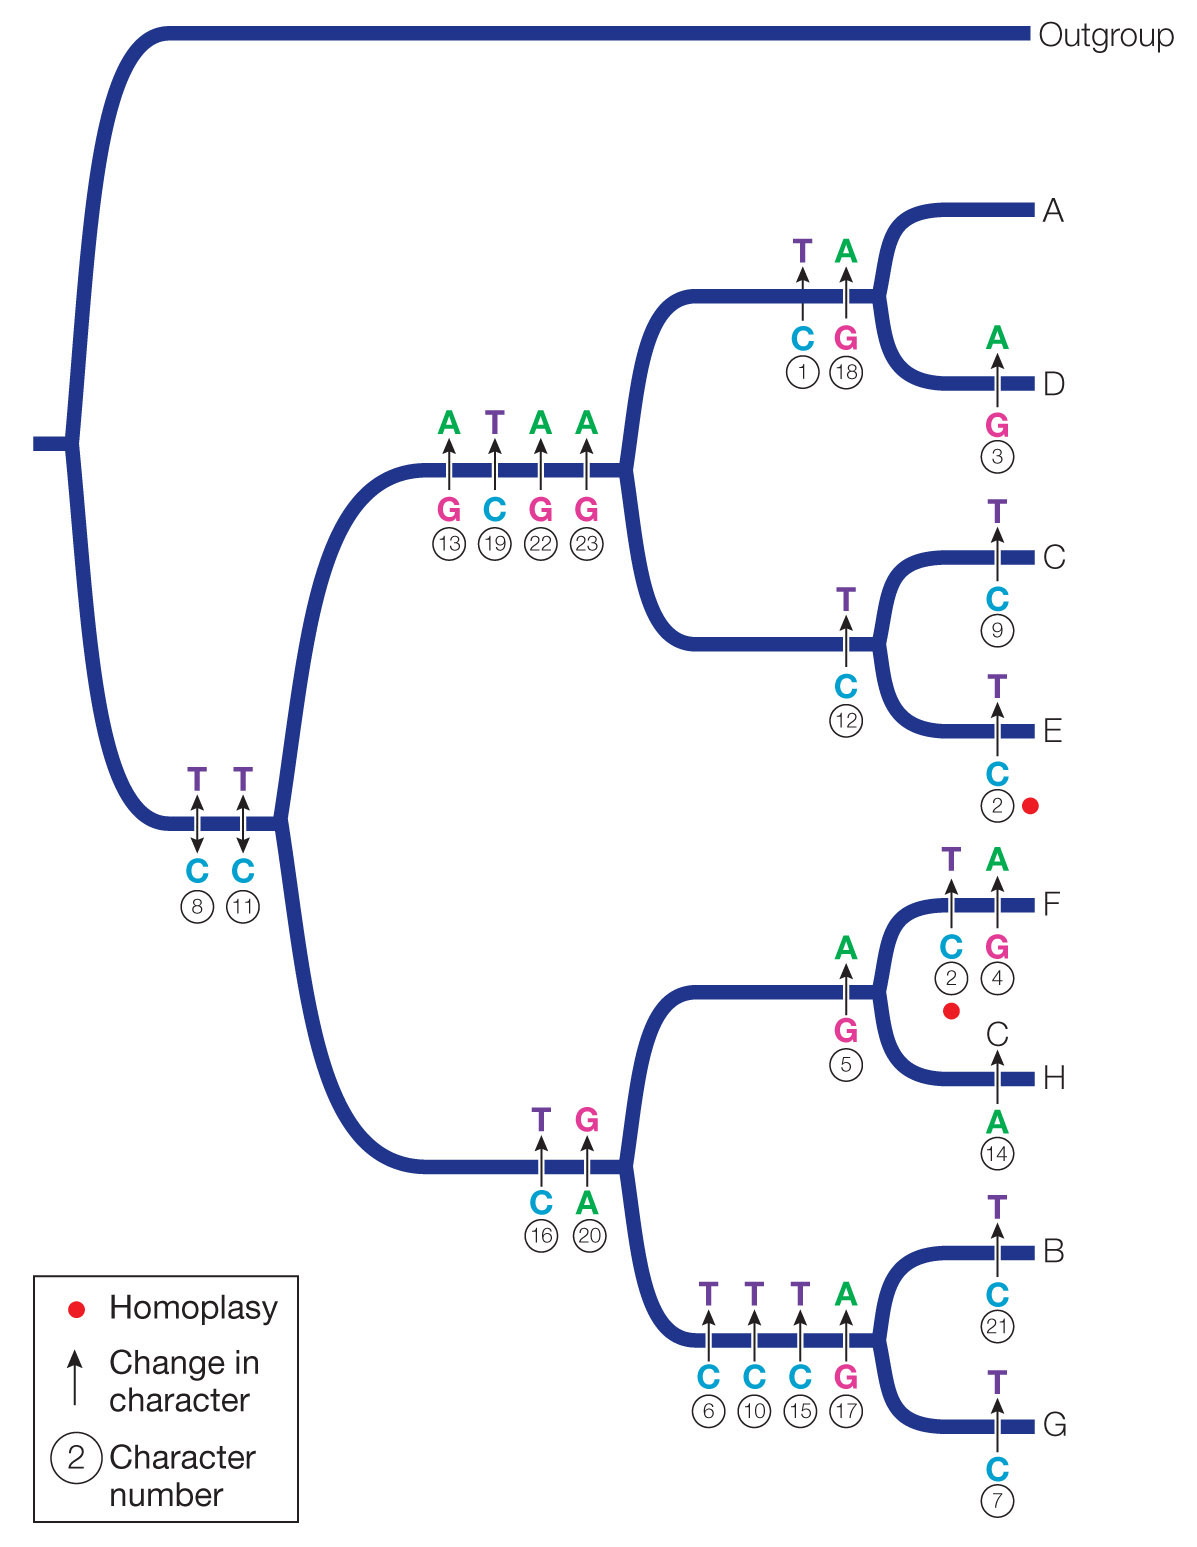
Construct a phylogenetic tree from the nucleotide positions using the parsimony principle (see Key Concept 21.2 and the examples in Table 21.1 and Figure 21.5). Use the outgroup to root your tree. Assume that all changes among nucleotides are equally likely.

2.
Using your tree from Question 1, reconstruct the DNA sequences of the ancestral lineages.
Ancestor of A and D: TCGGGCCCCCCCAACCGATACGG
Ancestor of C and E: CCGGGCCCCCCTAACCGGTACAA
Ancestor of F and H: CCGGACCCCCCCGACTGGCGCGG
Ancestor of B and G: CCGGGTCCCTCCGATTAGCGCGG
Ancestor of A, C, D, and E: CCGGGCCCCCCCAACCGGTACAA
Ancestor of B, F, G, and H: CCGGGCCCCCCCGACTGGCGCGG
Ancestor of A, B, C, D, E, F, G, and H: CCGGGCCCCCCCGACCGGCACGG
3.
Transitions are mutations that change one purine to the other (G ↔ A) or one pyrimidine to the other (C ↔ T), whereas transversions exchange a purine for a pyrimidine or vice versa (e.g., A → C or T; C → A or G). Which kind of mutation predominates in this phylogeny? Why might this be the case?
The reconstructed phylogeny requires 23 transitions and only 1 transversion. The viruses were grown in the presence of a mutagen, and the mutagen used in this experiment results predominantly in transitions.
A similar work with the data exercise may be assigned in LaunchPad.