16.2 Descriptive Statistics
The most basic task in statistics is taking a set of numbers and summarizing them in some way. Statistical techniques that do this are called descriptive statistics because these techniques are used to describe a set of cases.
The flowchart in Figure 16.2 walks through how to choose the correct descriptive statistic. Choosing the correct descriptive statistic depends on three things:
At what level the variable is measured: nominal, ordinal, or interval/ratio
What is being described: an individual case or a sample of cases
What is to be described: central tendency or variability
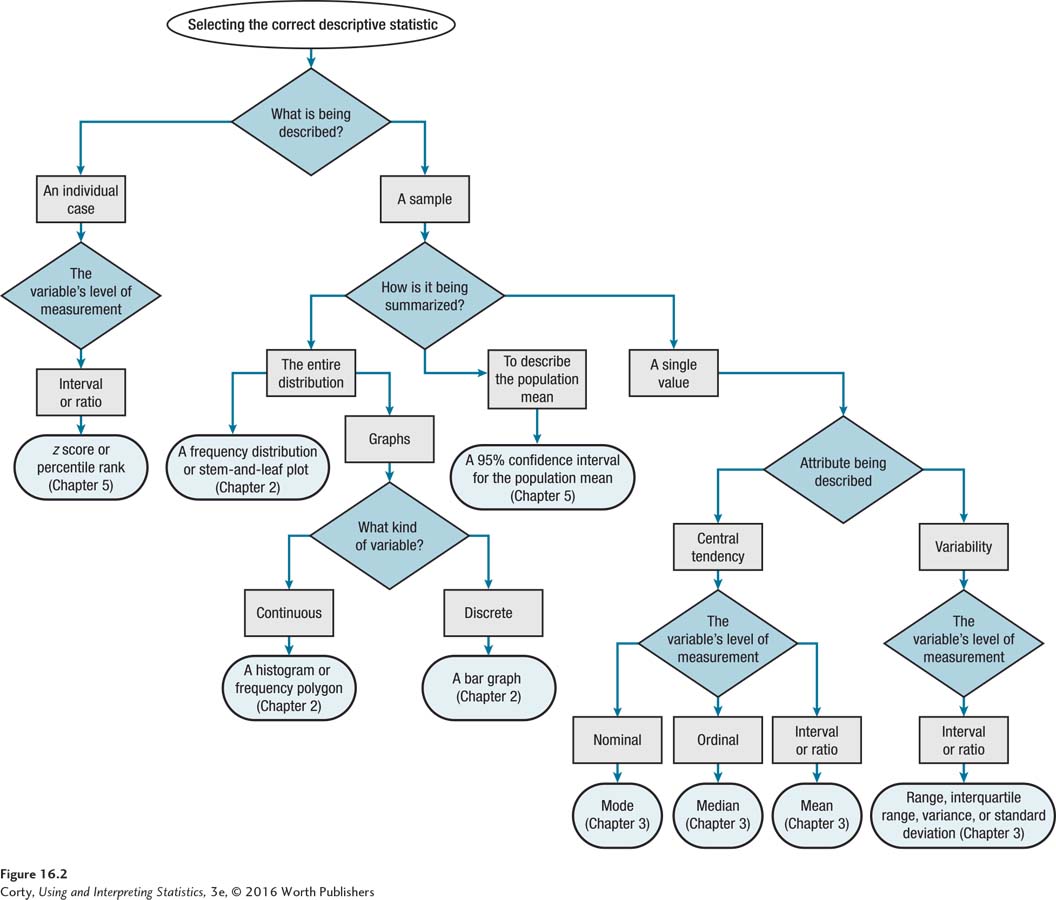
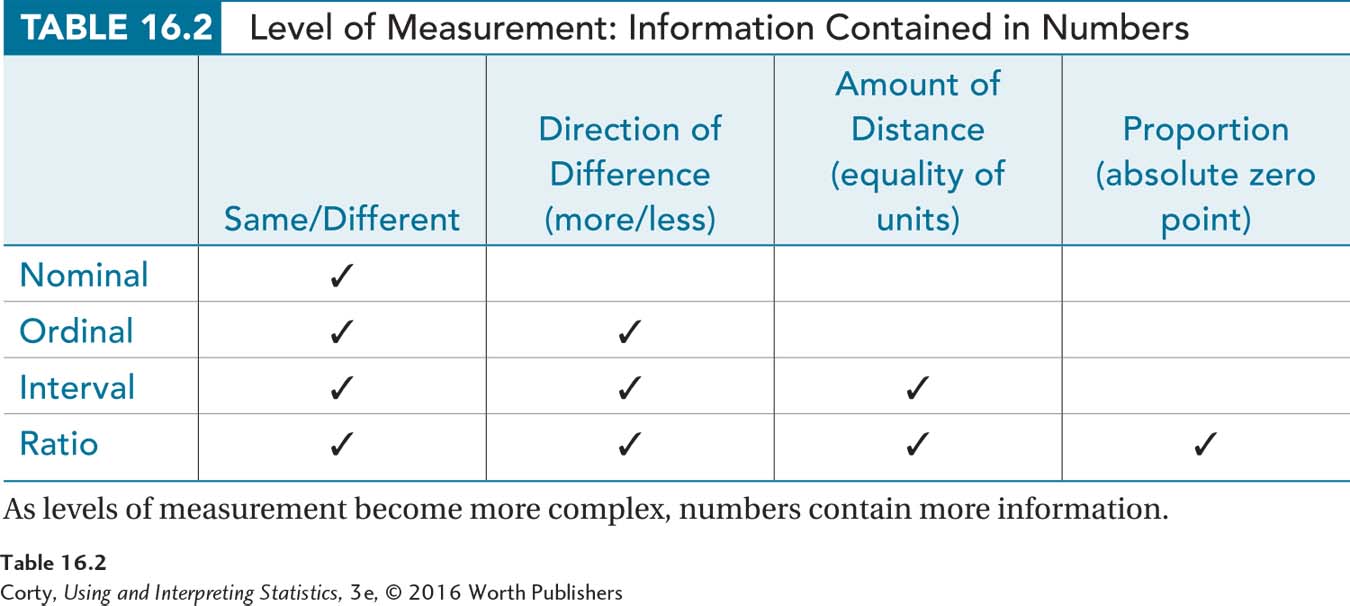
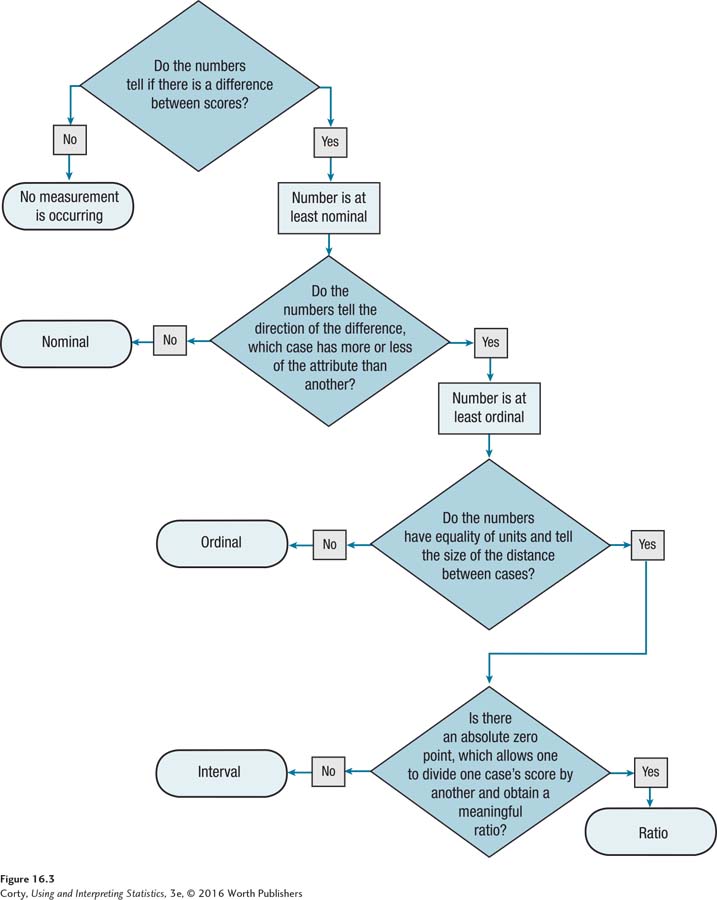
Knowing the level of measurement for the variable—nominal, ordinal, interval, or ratio—is important in statistics (see Chapter 1). Table 16.2 shows the distinctions among the four levels of measurement, and the flowchart in Figure 16.3 leads one through the steps for determining the level of measurement of a variable.
Describing Individual Cases
Sometimes the objective is to describe a single case. If the characteristic being measured for an individual case is measured at the interval or ratio level, it can be left as a raw score or transformed. Transformed scores have an advantage because they put scores into context. This book covered two types of transformed scores in Chapter 4:
z scores reveal (1) whether a score falls above or below the mean, and (2) how far away from the mean it falls.
Percentile ranks tell the percentage of scores in the distribution that fall at or below a score.
For example, a person with an IQ score of 115 could have his or her score transformed into a z score of 1.00 or a percentile rank of 84.13, both of which provide more information than the raw score.
Describing a Sample of Cases
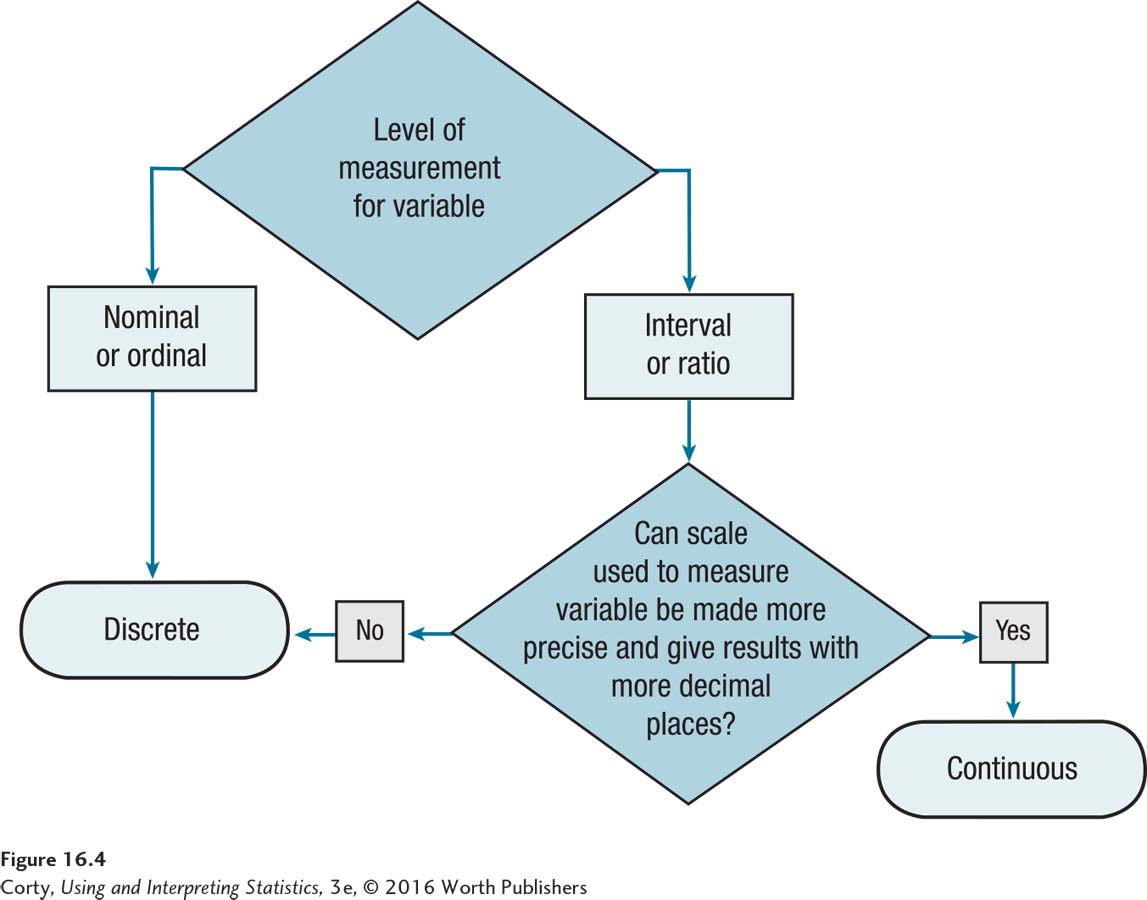
When a set of scores is a sample from a population, it can be summarized (1) by presenting the entire distribution or (2) with a single value that describes some aspect of the sample. As was covered in Chapter 2, the entire distribution can be summarized in a table (i.e., a frequency distribution or stem-and-leaf plot) or as a graph. Graphs have a visual advantage over tables. Which graph can be used (histogram, frequency polygon, or bar graph) depends on whether the variable is continuous or discrete. Figure 16.4 is a flowchart for determining if a variable is continuous or discrete.
When using a descriptive statistic to describe a sample of cases, a researcher can describe the central tendency or the variability in a set of cases (see Chapter 3). Usually, both are described. For example, a researcher might report both the average age of the participants and the range of ages.
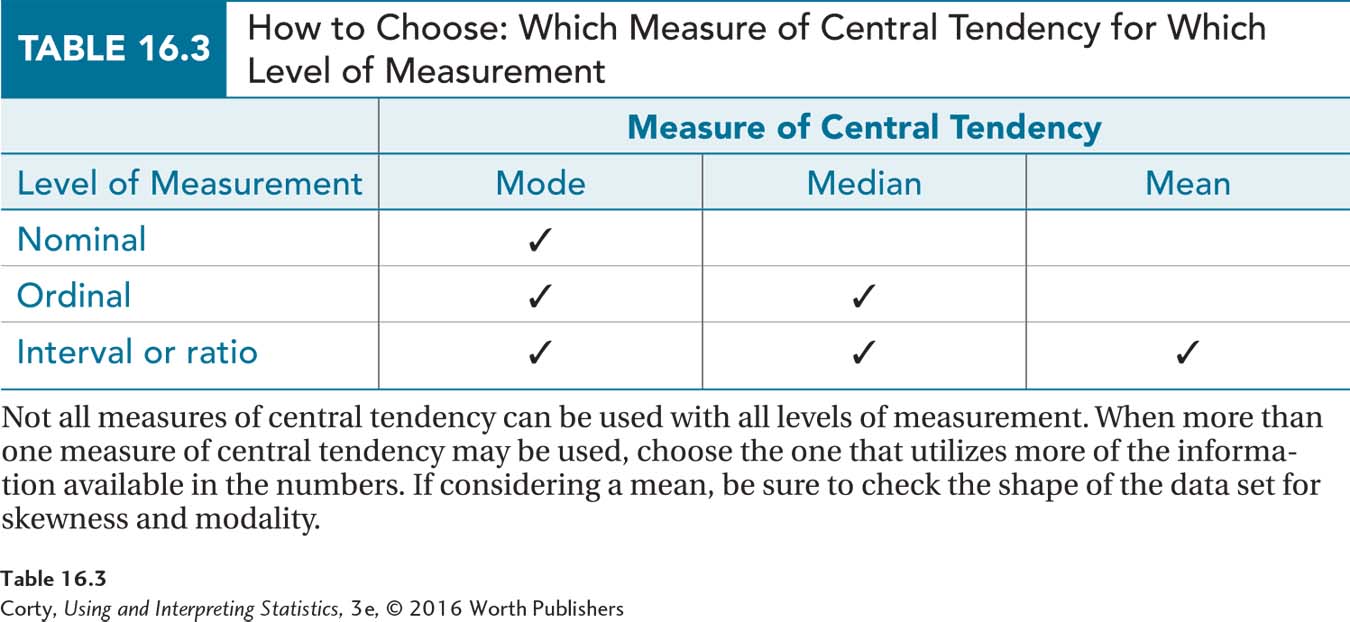
A measure of central tendency for a variable is chosen depending on its level of measurement (see Table 16.3). But other factors—such as the shape of the distribution (see Chapter 3)—also need to be taken into account when selecting a measure of central tendency.
To describe central tendency in a sample for a variable measured at the interval or ratio level, the go-to option is the mean (M ).
Central tendency for an ordinal-level variable is best measured with the median (Mdn).
Central tendency for a nominal variable can only be measured with a mode.
All of the descriptive statistics for variability (see Chapter 3) are used for interval-level or ratio-level variables. These statistics include the range, interquartile range (IQR), variance (s 2), and standard deviation (s). The standard deviation is the most commonly used measure of variability. Different abbreviations are used for variance and standard deviation depending on whether one is referring to a population value or sample value. A lowercase Greek sigma, σ, is used for population standard deviations and s for sample standard deviations.
Just like seeing a mountain from several sides gives a better idea of what it looks like, using multiple perspectives—multiple descriptive statistics—gives a better sense of a set of data. Here are multiple ways a teacher might report how well her class had done on a test. Each descriptive statistic by itself answers a specific question. Taken together, they provide a detailed and comprehensive view of class performance:
The teacher might use a frequency distribution, grouping scores into A’s, B’s, and so on to provide an overview of the class performance.
A single score like the mean would summarize the class’ performance, giving some sense of how easy (or difficult) the test was and how well (or how poorly) the class as a whole had done.
Page 624The standard deviation would indicate how much variability existed in the scores, how tightly they are packed around the mean.
The range would tell how badly the worst student had performed and how well the best student had performed. It would also reveal how much distance separated the best and the worst students.
If a student came in to talk about his or her performance, the teacher might transform that student’s score into a percentile rank in order to compare that student’s performance to the rest of the class.
Sometimes the results from a sample are used to describe a population. The population standard deviation, σ, is an example of this. σ is a point estimate, a single value. Chapter 5 covered confidence intervals, which give a range within which it is likely that the population value falls. If one has a sample measured on an interval- or ratio-level variable and wants to estimate what the average value is in the larger population, a confidence interval for the mean is the way to go.
Practice Problems 16.1
16.01 Read each scenario and decide whether the study is descriptive, experimental, quasi-experimental, or correlational.
An ethologist attaches motion sensors to house cats and to wild cats so that he can measure the amount of time that each type of cat spends resting/sleeping each day. He’s curious if wild cats spend more, less, or the same amount of time sleeping/resting as do house cats.
A physical fitness instructor is curious about how much time people spend at the gym. At his gym, people have to swipe in and swipe out. He collects data for a week, finding that the amount of time ranges from less than a minute to more than 9 hours, with a median time of 77 minutes.
An industrial/organizational psychologist obtained a random sample of employees at a large company. Among the questions she asked them was how good they thought the company was. She found that as the ages of the workers increased, so did their ratings of the “goodness” of the company.
16.02 Read the scenarios below and for each determine the level of measurement for the variable.
People who were not Chinese and who could not read Chinese viewed samples of Chinese writing written by Chinese people of different ages. They were asked to judge whether the passage was written by a pre-schooler (1), an elementary school–age child (2), a middle schooler (3), a high schooler (4), a young adult (5), a middle-aged person (6), or a senior citizen (7). The numbers in parentheses are the scores assigned to each answer.
Researchers wanted to find out if people could judge what sex a person was from a distance. They had participants watch videos of people walking toward them from 200 yards away and classify the subjects as −1 (male), 0 (can’t tell), or 1 (female).
Some personality psychologists wanted to measure “manliness.” They showed women pictures of men and had them rate the images as −1 (negative levels of manliness), 0 (neutral level of manliness), 1 (a small degree of manliness), 2 (more than a little, but less than average level of manliness), 3 (average level of manliness), 4 (somewhat above average in manliness), 5 (far above average in manliness), and 6 (off the top of the chart in terms of manliness).
16.03 Read each scenario and then select the appropriate descriptive statistic.
John attends a large university and is one of 450 people in introductory psychology. The last exam posed 73 questions, and John answered 62 correctly. John goes to see the professor because he would like to know how his performance compares to others in the same class.
The physical fitness instructor in Practice Problem 16.01(b) above wants to display the whole range of amounts of time people spend in the gym, as well as how “popular” the different amounts of time are.
The researchers in Practice Problem 16.02(b) above want to report what the average perceived sex is.
A hospital clothing manufacturer wants to re-size its one-size-fits-all hospital gowns now that Americans have grown larger. The manufacturer measures the weights of a sample of hospital patients from all 50 states and wishes to know the average weight of all Americans.