STEP-BY-STEP TECHNOLOGY GUIDE: Analysis of Variance
TI-83/84
Performing ANOVA
- Step 1 Enter the Dormitory A data in L1, the Dormitory B data in L2, and the Dormitory C data in L3.
- Step 2 Press STAT, highlight TESTS, select “ANOVA(”, and press ENTER.
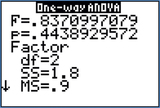
- Step 3 On the home screen, enter “L1, L2, L3)” and press ENTER (Figure 19).
Finding the p-Value for a Given Fdata.
p-value=P(F>Fdata)=P(F>0.8370997079)
where df1=2 and df2=27.
- Step 1 Press 2nd DISTR.
- Step 2 Select 0: Fcdf( and press ENTER.
- Step 3 Enter “0.8370997079, 1E99, 2, 27)” and press ENTER.
The results are shown in Figure 8 (page 674).
EXCEL
Performing ANOVA
- Step 1 Enter the Dormitory A data in column A, the Dormitory B data in column B, and the Dormitory C data in column C.
- Step 2 Click Data > Data Analysis > Anova: Single Factor, and click OK.
- Step 3 Select the input range of the data by clicking and dragging over the data in A1 to C10. Select Grouped by: Columns. Then click OK.
Finding the p-Value for a Given Fdata.
p-value=P(F>Fdata)=P(F>0.8370997079),
where df1=2 and df2=27.
- Step 1 Select cell A1. Click the Insert Function icon fx.
- Step 2 For Search for a Function, type FDIST and click Go, then OK.
- Step 3 For X, enter 0.8370997079, for Deg_freedom 1, enter 2, and for Deg_freedom 2, enter 27. Then click OK. The cell now contains the p-value: 0.443892952.
MINITAB
Performing ANOVA
Minitab accepts data in two different forms for performing ANOVA, stacked or unstacked. Unstacked refers to the data of each group being in a separate column. Stacked merges each group's data together in a single column, with the group numbers in a different column.
ANOVA (Stacked)
- Step 1 Enter the GPA data for all three groups in C1 and the values for the categorical variable Dorm in C2.
- Step 2 Click on Stat > ANOVA > One-Way…
- Step 3 From the drop-down menu, choose Response data are in one column for all factor levels. Choose the quantitative variable GPA as your Response and the categorical variable Dorm as your Factor. Then click OK.
ANOVA (Unstacked)
- Step 1 Enter the Dormitory A data in C1, the Dormitory B data in C2, and the Dormitory C data in C3.
- Step 2 Click Stat > ANOVA > One-Way….
- Step 3 From the drop-down menu, choose Response data are in a separate column for each factor level. Enter columns C1, C2, and C3 into the Responses box. Click OK.
Finding the p-Value for a Given Fdata
p-value=P(F>Fdata)=P(F>0.8370997079),
where df1=2 and df2=27.
- Step 1 Click Calc > Probability Distributions > F.
- Step 2 Select Cumulative Probability, enter 2 for Numerator degrees of freedom, and 27 for Denominator degrees of freedom.
- Step 3 Select Input Constant, enter 0.8370997079, and click OK.
- Step 4 Minitab then displays the cumulative probability P(F,0.837100)=0.556107. This cumulative probability represents the area to the left of 0.837100 (the unshaded area in Figure 7, page 674). The entire area under the curve equals 1, so to get the p-value, we need to subtract P(F<0.837100)=0.556107 from 1:
p-value=P(F<0.837100)=1−P(F<0.837100)=1−0.556107=0.443893
SPSS
- Step 1 Enter the data for all three dormitories into the first column, and a numeric code for dormitory labels in the second column (1 for A, 2 for B, 3 for C). Name the columns GPA and Dorm, respectively.
- Step 2 Click Analyze > Compare Means > One-way Anova….
- Step 3 Put GPA in the Dependent List box, and Dorm in the Factor box. Click OK. Output is shown in Figure 20.
Finding the p-Value for a Given Fdata
p-value=P(F>Fdata)=P(F>0.8370997079),
where df1=2 and df2=27.
- Step 1 Put a placeholder number in the first space of the first column.
- Step 2 Click Transform > Compute Variable. Enter the column name in Target Variable. Under Function Group, select CDF & Noncentral CDF. Under Functions and Special Variables, double-click Cdf.F.
Step 3 In Numeric Expression, replace the question marks with 0.8370997079, 2, and 27 in that order. Click OK twice.
Minimize the output window.
- Step 4 SPSS then displays the cumulative probability P(F<0.8370997079)=.55610704797049. We need to subtract P(F<0.8370997079)=0.556107 from 1:
p-value=P(F<0.8370997079)=1−P(F<0.837100)=1−0.556107=0.443893
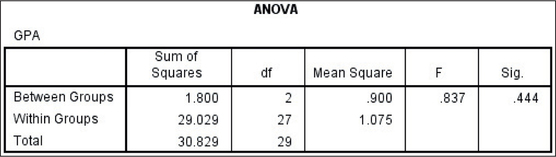 FIGURE 20 SPSS ANOVA output.
JMP
(Table 1, page 666, is used to illustrate the procedure.)
- Step 1 Select File > New > Data Table. Enter the data for all three dormitories into the first column, and the dormitory labels A, B, and C in the second column. Name the columns GPA and Dorm, respectively. Right-click on the Dorm column header, and change Data Type to Character. Click OK.
- Step 2 Click Analyze > Fit Y by X. Move GPA to Y, Response and Dorm to X, Factor. Click OK.
- Step 3 Click the red triangle beside “Oneway Analysis of GPA by Dorm,” and click Means/Anova . The ANOVA output is found in the Analysis of Variance table.
Finding the p-Value for a Given Fdata
p-value=P(F>Fdata)=P(F>0.8370997079),
where df1=2 and df2=27.
- Step 1 Click File > New > Data Table. Put a placeholder value in the first entry of the first column, then click the column's header, and click Cols > Formula….
- Step 2 Under Functions (grouped) select Probability, then F Distribution.
- Step 3 In the formula, replace x with 0.8370997079, DF numer with 2, and DF denom with 27. Click OK. JMP displays the probability P(F<0.8370997079)=.55610704797049. We need to subtract P(F<0.8370997079)=0.556107 from 1:
p-value=P(F<0.8370997079)=1−P(F<0.837100)=1−0.556107=0.443893
CRUNCHIT!
One-Way ANOVA
- Step 1 Click File, then highlight Load from Larose, Discostat3e > Chapter 12, and click on Example 01_05.
- Step 2 Click Statistics, highlight ANOVA and select One-way. Choose the Columns tab. Select each of the available columns and click Calculate.