Printed Page 691(cont.)
STEP-BY-STEP TECHNOLOGY GUIDE: Multiple Comparisons
Neither the TI-83/84 nor Excel performs multiple comparisons.
MINITAB
- Step 1 Enter the data for ANOVA into columns C1, C2, etc., as shown in the Section 12.1 technology guide on page 679.
- Step 2 Select Stat > ANOVA > One way…. Choose either Response data are in one column for all factor levels or Response data are in a separate column for each factor level, depending on how you entered your data in Step 1. Enter the response and factor information as necessary.
- Step 3 Click Comparisons…, check Tukey, and enter Error rate for comparisons (such as “5” for αEW=0.05). Click OK twice. For the data in Example 9, this is shown in Figure 24.
SPSS
We demonstrate using the data from Example 9.
- Step 1 Enter the Motivation data into the first column and a numeric code for the Disclosure groups in the second column. For example, let 2 represent High disclosure, 1 represent Medium disclosure, and 0 represent Low disclosure. Under the Variable View tab, set the decimals for the Disclosure variable to zero.
- Step 2 Select Analyze > Compare Means > One-way ANOVA…. Move Motivation to Dependent List, and Disclosure to Factor.
- Step 3 Click Post Hoc…, check Tukey, and enter a Significance level of 0.05. Click Continue, then OK. The output is in Figure 26.
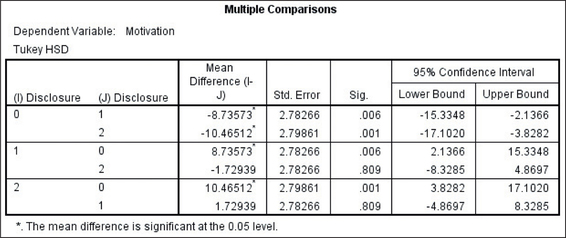 FIGURE 26 SPSS output.
JMP
We demonstrate using the data from Example 9.
- Step 1 Select File > New > Data Table. Enter the Motivation values in the first column, and the Disclosure numeric labels in the second column. Right-click the Disclosure column heading, select Column Info…, and change Data Type to Character.
- Step 2 Click Analyze > Fit Y by X. Move Motivation to Y, Response and Disclosure to X, Factor. Click OK.
- Step 3 Click the red triangle beside “Oneway Analysis,” and click Compare Means > All pairs, Tukey HSD. The output is shown in Figure 25 of Example 9.
[Leave] [Close]