Section 9.6 Exercises
CLARIFYING THE CONCEPTS
Question 9.324
1. Think of one instance where an analyst would be interested in performing a hypothesis test about the population standard deviation σ. (p. 556)
9.6.1
Answers will vary.
Question 9.325
2. What is the difference between σ and σ0? (p. 558)
Question 9.326
3. Does it make sense to test whether σ<0? Explain. (p. 556)
9.6.3
No, σ will never be less than 0.
Question 9.327
4. What condition must be fulfilled for us to perform a hypothesis test about σ? (p. 556)
Question 9.328
5. Explain how we can use a confidence interval to determine significance. (p. 561)
9.6.5
Answers will vary.
Question 9.329
6. In the previous exercise, what must be the relationship between α and the confidence level? (p. 561)
PRACTICING THE TECHNIQUES
 CHECK IT OUT!
| To do | Check out | Topic |
|---|---|---|
| Exercises 7–12 | Example 31 |
χ2 test for σ: critical- value method |
| Exercises 13–18 | Example 32 |
χ2 test for σ: p-value method |
| Exercises 19–22 | Example 33 | Using confidence intervals for σ to conduct two-tailed χ2 tests for σ |
For Exercises 7–12, a random sample is drawn from a normal population. For each exercise, do the following:
- State the hypotheses.
- Find the χ2 critical values and state the rejection rule.
- Calculate χ2data.
- Compare χ2data with the critical value or values. State the conclusion and interpretation.
Question 9.330
7. Test whether σ>1, using α=0.05. We have a sample of size n=21 and a sample variance of s2=3.
9.6.7
(a) H0:σ=1 vs. Ha:σ>1 (b) χ2α=χ20.05=31.410. Reject H0 if χ2data≥31.410. (c) χ2data=60 (d) Since χ2data≥31.410, reject H0. There is evidence that the population standard deviation is greater than 1.
Question 9.331
8. Test whether σ<5, using α=0.05. We have a sample of size n=11 and a sample variance of s2=25.
Question 9.332
9. Test whether σ≠3, using α=0.05. We have a sample of size n=16 and a standard deviation of s=2.5.
9.6.9
(a) H0:σ=3 vs. Ha:σ≠3 (b) χ2α/2=χ20.025=27.488 and χ21−α/2=χ20.975=6.262. Reject H0 if χ2data≤6.262 or χ2data≥27.488. (c) χ2data=10.417 (d) Since χ2data is not ≤6.262 and χ2data is not ≥27.488, we do not reject H0. There is insufficient evidence that the population standard deviation is different from 3.
Question 9.333
10. Test whether σ>10, using α=0.01. We have a sample of size n=14 and a standard deviation of s=12.
Question 9.334
11. Test whether σ<20, using α=0.10. We have a sample of size n=8 and a sample variance of s2=350.
9.6.11
(a) H0:σ=20 vs. Ha:σ<20 (b) χ21−α=χ20.90=2.833. Reject H0 if χ2data≤2.833. (c) χ2data=6.125 (d) Since χ2data is not ≤2.833, we do not reject H0. There is insufficient evidence that the population standard deviation is less than 20.
Question 9.335
12. Test whether σ≠5, using α=0.05. We have a sample of size n=26 with a standard deviation of s=5.
For Exercises 13–18, a random sample is drawn from a normal population. Do the following:
- State the hypotheses and the rejection rule.
- Calculate χ2data . Draw a χ2 distribution and indicate the location of χ2data.
- Find the p-value and indicate the p-value in your distribution in (b).
- Compare the p-value with level of significance α=0.05. State the conclusion and interpretation.
Question 9.336
13. We are testing whether σ>1 and have a sample of size n=21 with a sample variance of s2=3.
9.6.13
(a) H0:σ=1 versus Ha:σ>1 Reject H0 if the p-value≤α=0.05. (b) χ2data=60
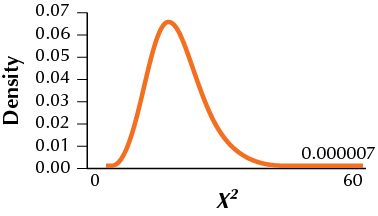
(c) p-value=7.121750863×10⁻⁶ (d) Since the p-value≤ 0.05, we reject H0. There is evidence that the population standard deviation is greater than 1.
Question 9.337
14. We are testing whether σ<5 and have a sample of size n=11 with a sample variance of s2=25.
Question 9.338
15. We are testing whether σ≠3 and have a sample of size n=16 with a standard deviation of s=2.5.
9.6.15
(a) H0:σ=3 vs. Ha:σ≠3. Reject H0 if the p-value≤α=0.05. (b) χ2data=10.417
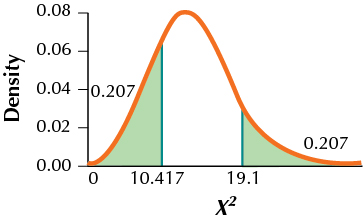
(c) p-value=0.4145552434 (d) Since the p-value is not ≤0.05, we do not reject H0. There is insufficient evidence that the population standard deviation is different from 3.
Question 9.339
16. We are testing whether σ>10 and have a sample of size n=14 with a standard deviation of s=12.
Question 9.340
17. We are testing whether σ<20, and have a sample of size n=8 and a sample variance of s2=350.
9.6.17
(a) H0:σ=20 vs. Ha:σ<20. Reject H0 if the p-value≤α=0.05. (b) χ2data=6.125
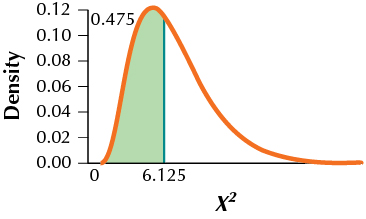
(c) p-value=0.4747679539 (d) Since the p-value is not ≤0.05, we do not reject H0. There is insufficient evidence that the population standard deviation is less than 20.
Question 9.341
18. We are testing whether σ≠5 and have a sample of size n=26 with a standard deviation of s=5.
For Exercises 19–22, a 100(1-α)%χ2 confidence interval for σ is given. Use the confidence interval to test, using level of significance α, whether σ differs from each of the indicated hypothesized values.
Question 9.342
19. A 95% χ2 confidence interval for σ is (1, 4). Hypothesized values σ0 are
- 0
- 2
- 5
9.6.19
| Value of σ0 | Form of hypothesis test, with α=0.05 | Where σ0 lies in relation to 95% confidence interval (1, 4) | Conclusion of hypothesis test | |
|---|---|---|---|---|
| (a) | 0 | H0:σ=0 vs.Ha:σ≠0 | Outside | Reject H0 |
| (b) | 2 | H0:σ=2 vs.Ha:σ≠2 | Inside | Do not reject H0 |
| (c) | 5 | H0:σ=5 vs.Ha:σ≠5 | Outside | Reject H0 |
Question 9.343
20. A 99% χ2 confidence interval for σ is (10, 25). Hypothesized values σ0 are
- 15
- 26
- 5
Question 9.344
21. A 90% χ2 confidence interval for σ is (100, 200). Hypothesized values σ0 are
- 150
- 250
- 0
9.6.21
| Value of σ0 | Form of hypothesis test, with α=0.10 | Where σ0 lies in relation to 90% confidence interval (100, 200) | Conclusion of hypothesis test | |
|---|---|---|---|---|
| (a) | 150 | H0:σ=150 vs.Ha:σ≠150 | Inside | Do not reject H0 |
| (b) | 250 | H0:σ=250 vs.Ha:σ≠250 | Outside | Reject H0 |
| (c) | 0 | H0:σ=0 vs.Ha:σ≠0 | Outside | Reject H0 |
Question 9.345
22. A 95% χ2 confidence interval for σ is (127, 698). Hypothesized values σ0 are
- 125
- 128
- 700
APPLYING THE CONCEPTS
Question 9.346
biomass
23. Biomass Power Plants. Power plants around the country are retooling in order to consume biomass instead of or in addition to coal. The table contains a random sample of nine such power plants and the amount of energy generated in megawatts (MW) in 2014.16 The normality was checked in the Section 8.4 exercises. Test whether the population standard deviation differs from 25 MW, using level of significance α=0.05.
| Company | Location | Capacity (MW) |
|---|---|---|
| Hoge Lumber Co. | New Knoxville, Ohio |
3.7 |
| Evergreen Clean Energy | Eagle, CO | 12.0 |
| GreenHunter Energy | Grapevine, TX | 18.5 |
| Covanta Energy Corporation |
Niagara Falls, NY | 30.0 |
| Northwest Energy Systems Co. |
Warm Springs, OR |
37.0 |
| Riverstone Holdings | Kenansville, NC | 44.1 |
| Lee County Solid Waste Authority |
Ft. Myers, FL | 57.0 |
| Energy Investor Funds | Detroit, MI | 68.0 |
| Dominion Virginia Power | Hurt, VA | 83.0 |
9.6.23
Step 1 H0:σ=25 vs. Ha:σ≠25
Step 2 χ20.975=2.180 and χ20.025=17.535. Therefore we reject H0 if χ2data≤χ20.975=2.180 or χ2data≥χ20.025=17.535.
Step 3 χ2data=8.97
Step 4 χ2data=8.97 is not ≤χ20.975=2.180 and is not ≥χ20.025=17.535, so we do not reject H0. There is insufficient evidence at level of significance α=0.05 that the population standard deviation differs from 25 MW.
Question 9.347
carbon
24. Carbon Emissions. The following table represents the carbon emissions (in millions of tons) from consumption of fossil fuels, for a random sample of five nations.17 Test whether the population standard deviation is greater than 100 million tons, using level of significance α=0.10.
| Nation | Emissions (in millions of tons) |
|---|---|
| Brazil | 361 |
| Germany | 844 |
| Mexico | 398 |
| Great Britain | 577 |
| Canada | 631 |
Question 9.348
cerealcalories
25. Calories in Breakfast Cereals. A random sample of six well-known breakfast cereals yielded the following calorie data. Can we perform a χ2 test for the population standard deviation of the number of calories? Why or why not?
| Cereal | Calories |
|---|---|
| Apple Jacks | 110 |
| Cocoa Puffs | 110 |
| Mueslix | 160 |
| Cheerios | 110 |
| Corn Flakes | 100 |
| Shredded Wheat | 80 |
9.6.25
No, population is not normal.
Question 9.349
deepwaterclean
26. Deepwater Horizon Cleanup Costs. The following table represents the amount of money disbursed by BP to a random sample of six Florida counties, for cleanup of the Deepwater Horizon oil spill, in millions of dollars.18 The normality of the data was confirmed in the Section 8.1 exercises. Test whether the population standard deviation is less than $500,000, using level of significance α=0.05.
| County | Cleanup costs ($ millions) |
|---|---|
| Broward | 0.85 |
| Escambia | 0.70 |
| Franklin | 0.50 |
| Pinellas | 1.15 |
| Santa Rosa | 0.50 |
| Walton | 1.35 |
Question 9.350
27. Does Score Variability Differ by Gender? Recently, researchers have been examining the evidence for whether there is greater variability in boys' scores than girls' scores on cognitive abilities tests. For example, one study found that boys were overrepresented at both the top and the bottom of nonverbal reasoning tests and quantitative reasoning tests.19 Suppose that the standard deviation for girls' scores is known to be 50 points for a particular test and that the population of all scores is normal. A random sample of 101 boys has a sample variance of 2600. Test whether the population standard deviation for boys exceeds 50 points, using level of significance α=0.05.
9.6.27
p-value method: H0:σ=50 vs. Ha:σ>50. Reject H0 if p-value. ≤0.05. χ2data=104. p-value=0.3721497012. Since p-value is not ≤0.05, we do not reject H0. There is insufficient evidence that the population standard deviation of test scores for boys is greater than 50 points.
Critical-value method: H0:σ=50 vs. Ha:σ>50. χ2α=χ20.05=124.342. Reject H0 if χ2data≥124.342.χ2data=104. Since χ2data is not ≥124.342, we do not reject H0. There is insufficient evidence that the population standard deviation of test scores for boys is greater than 50 points.
Question 9.351
28. Heart Rate Variability. A reduction in heart rate variability is associated with elevated levels of stress, because the body continues to pump adrenaline after high-stress situations, even when at rest.20 Suppose the standard deviation of heartbeats in the general population is 20 beats per minute, and that the population of heart rates is normal. A random sample of 50 individuals leading high-stress lives has a sample variance of 200 beats per minute. Test, using level of significance α=0.05, whether the population standard deviation for those leading high-stress lives is lower than that in the general population.