Section 9.7 Exercises
CLARIFYING THE CONCEPTS
Question 9.352
1. Explain what a Type II error is. (p. 565)
9.7.1
A Type II error is not rejecting H0 when H0 is false.
Question 9.353
2. Describe what ˉxcrit is. (p. 565)
Question 9.354
3. In words, what do we mean by the power of a hypothesis test? (p. 567)
9.7.3
The probability of rejecting H0 when H0 is false.
Question 9.355
4. How do we calculate the power of a test? (p. 567)
PRACTICING THE TECHNIQUES
 CHECK IT OUT!
| To do | Check out | Topic |
|---|---|---|
| Exercises 5–16 | Example 34 | Calculating β, the probability of a Type II error |
| Exercises 17–28 | Example 35 | Power of a hypothesis test |
| Exercises 29–30 | Example 36 | Power curve |
For Exercises 5–16, assume that the conditions for performing the Z test are met.
For Exercises 5–16, do the following:
- Calculate the value or values of ˉxcrit.
- Draw a normal curve, centered at μa, with the value or values of ˉxcrit indicated.
- Calculate β, the probability of a Type II error for that value of μa. Shade the corresponding area under the normal curve.
Question 9.356
5. H0:μ=50 vs. Ha:μ>50,α=0.10,σ=4,n=25,μa=51
9.7.5
(a) 51.024
(b)
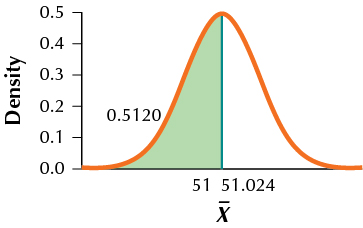
(c) 0.5120
Question 9.357
6. H0:μ=50 vs. Ha:μ>50,α=0.10,σ=4,n=25,μa=52
Question 9.358
7. H0:μ=50 vs. Ha:μ>50,α=0.10,σ=4,n=25,μa=53
9.7.7
(a) 51.024
(b)
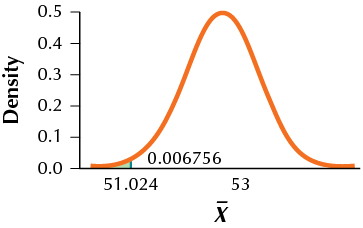
(c) 0.0068
Question 9.359
8. H0:μ=50 vs. Ha:μ>50,α=0.10,σ=4,n=25,μa=54
Question 9.360
9. H0:μ=50 vs. Ha:μ>50,α=0.10,σ=4,n=25,μa=55
9.7.9
(a) 51.024
(b)
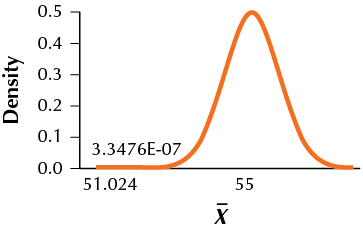
(c) TI-83/84: 0.0000003353
Question 9.361
10. H0:μ=50 vs. Ha:μ>50,α=0.10,σ=4,n=25,μa=56
Question 9.362
11. H0:μ=100 vs. Ha:μ>100,α=0.05,σ=12,n=36,μa=96
9.7.11
(a) 96.71
(b)
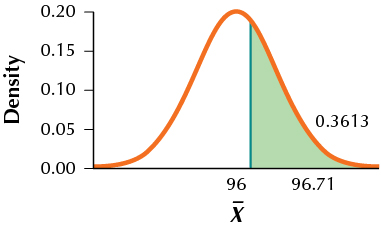
(c) 0.3613
Question 9.363
12. H0:μ=100 vs. Ha:μ<100,α=0.05,σ=12,n=36,μa=94
Question 9.364
13. H0:μ=100 vs. Ha:μ<100,α=0.05,σ=12,n=36,μa=92
9.7.13
(a) 96.71
(b)
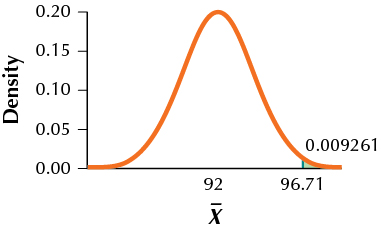
(c) 0.0093
Question 9.365
14. H0:μ=100 vs. Ha:μ<100,α=0.05,σ=12,n=36,μa=90
Question 9.366
15. H0:μ=100 vs. Ha:μ<100,α=0.05,σ=12,n=36,μa=88
9.7.15
(a) 96.71
(b)
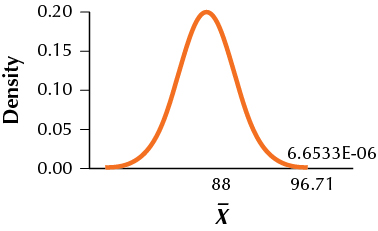
(c) 0.000006658
Question 9.367
16. H0:μ=100 vs. Ha:μ<100,α=0.05,σ=12,n=36,μa=86
For Exercises 17–28, calculate the power of the hypothesis test for the indicated exercise.
Question 9.368
17. Exercise 5
9.7.17
0.4880
Question 9.369
18. Exercise 6
Question 9.370
19. Exercise 7
9.7.19
0.9932
Question 9.371
20. Exercise 8
Question 9.372
21. Exercise 9
9.7.21
0.9999996647
Question 9.373
22. Exercise 10
Question 9.374
23. Exercise 11
9.7.23
0.6387
Question 9.375
24. Exercise 12
Question 9.376
25. Exercise 13
9.7.25
0.9907
Question 9.377
26. Exercise 14
Question 9.378
27. Exercise 15
9.7.27
0.999993342
Question 9.379
28. Exercise 16
Question 9.380
29. Refer to Exercises 17–22. Construct the power curve for the given values of μa.
9.7.29
Question 9.381
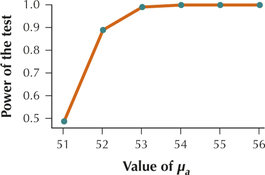
30. Refer to Exercises 23–28. Construct the power curve for the given values of μa.
APPLYING THE CONCEPTS
Question 9.382
31. Stock Market. The Statistical Abstract of the United States reports that the mean daily number of shares traded on the New York Stock Exchange in 2009 was 2.9 billion. Let this value represent the hypothesized population mean, and assume that the population standard deviation equals 0.7 billion shares. Suppose that we have a random sample of 36 days from the present year, and we are interested in testing whether the population mean daily number of shares traded has increased, using level of significance α=0.05.
- Describe what a Type II error would mean in the context of this problem.
- What is the probability of making a Type II error when the actual mean number of shares traded equals the following values?
- 3.0 billion
- 3.1 billion
- 3.2 billion
- 3.3 billion
- Calculate the power of the hypothesis test for the values of μa given in (b).
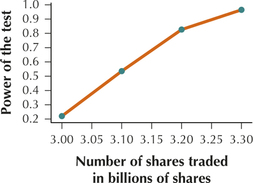
- Construct the power curve for the values of μa given in (b).
9.7.31
(a) Concluding that the population mean daily number of shares traded equals 2.9 billion shares when, in reality, it has increased from 2.9 billion shares.
(b) and (c)
| μα | Probability of Type 11 error: β | Power of Test: 1−β | |
|---|---|---|---|
| (i) | 3.0 billion | P(Z<3.09−3.00.7/√36)=P(Z<0.77)=0.7794 | 1−0.7794=0.2206 |
| (ii) | 3.1 billion | P(Z<3.09−3.10.7/√36)=P(Z<−0.09)=0.4641 | 1−0.4641=0.5359 |
| (iii) | 3.2 billion | P(Z<3.09−3.20.7/√36)=P(Z<−0.94)=0.1736 | 1−0.1736=0.8264 |
| (iv) | 3.3 billion | P(Z<3.09−3.30.7/√36)=P(Z<−1.8)=0.0359 | 1−0.0359=0.9641 |
(d)
Question 9.383
32. Credit Scores in Georgia. According to CreditReport.com, the mean credit score in Georgia in 2014 was 668. Suppose we have a recent random sample of 900 credit scores in Georgia, and assume that the population standard deviation is 150. We are interested in testing using level of significance α=0.05 whether the population mean credit score in Georgia has decreased since that time.
- Describe what a Type II error would mean in the context of this problem.
- What is the probability of making a Type II error when the actual mean credit score takes the following values?
- 650
- 645
- 640
- 635
- Calculate the power of the hypothesis test for the values of μa given in (b).
- Construct the power curve for the values of μa given in (b).
Question 9.384
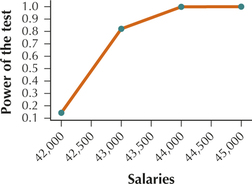
33. Accountants' Salaries. According to Salary.com, the mean salary for entry-level accountants in 2010 was $41,560. Let this value represent the hypothesized population mean, and assume that the population standard deviation equals $5000. Suppose we have a recent random sample of 100 entry-level accountants and want to test, using level of significance α=0.05, whether the population mean salary has changed since 2010.
- Describe what a Type II error would mean in the context of this problem.
- What is the probability of making a Type II error when the actual mean salary takes the following values?
- $42,000
- $43,000
- $44,000
- $45,000
- Calculate the power of the hypothesis test for the values of μa given in (b).
- Construct the power curve for the values of μa given in (b).
9.7.33
(a) Concluding that the population mean salary for accountants is equal to $41,560 when, in reality, it has changed from $41,560.
(b) and (c)
| μα | Probability of Type 11 error: β | Power of Test: 1 – β |
|---|---|---|
| (i) $42,000 | P(40,580−42,0005000/√100<Z<42,540−42,0005000/√100)=P(−2.84<Z<1.08)=0.8599−0.0023=0.8576 | 1−0.8576=0.1424 |
| (ii) $43,000 | P(40,580−43,0005000/√100<Z<42,540−43,0005000/√100)=P(−4.84<Z<−0.92)=0.1788−0=0.1788 | 1−0.1788=0.8212 |
| (iii) $44,000 | P(40,580−44,0005000/√100<Z<42,540−44,0005000/√100)=P(−6.84<Z<−2.92)=0.0018−0=0.0018 | 1−0.0018=0.9982 |
| (iv) $45,000 | P(40,580−45,0005000/√100<Z<42,540−45,0005000/√100)=P(−8.84<Z<−4.92)=0−0=0 | 1−0=1 |
(d)
Question 9.385
34. Price of Milk. The U.S. Bureau of Labor Statistics reports that the mean price for a gallon of milk in June 2014 was $3.63. Suppose that we have a random sample taken this year of 400 gallons of milk, and assume that the population standard deviation equals $1.00. We want to conduct a hypothesis test, using level of significance α=0.01, to investigate if the population mean price of milk this year has increased.
- Describe what a Type II error would mean in the context of this problem.
- What is the probability of making a Type II error when the actual mean price takes the following values?
- $3.70
- $3.90
- $4.10
- $4.30
- Calculate the power of the hypothesis test for the values of μa given in (b).
- Construct the power curve for the values of μa given in (b).