Transforming Landscapes of Well-Being
366
CHAPTER 9
DEVELOPMENT GEOGRAPHY
Transforming Landscapes of Well-Being
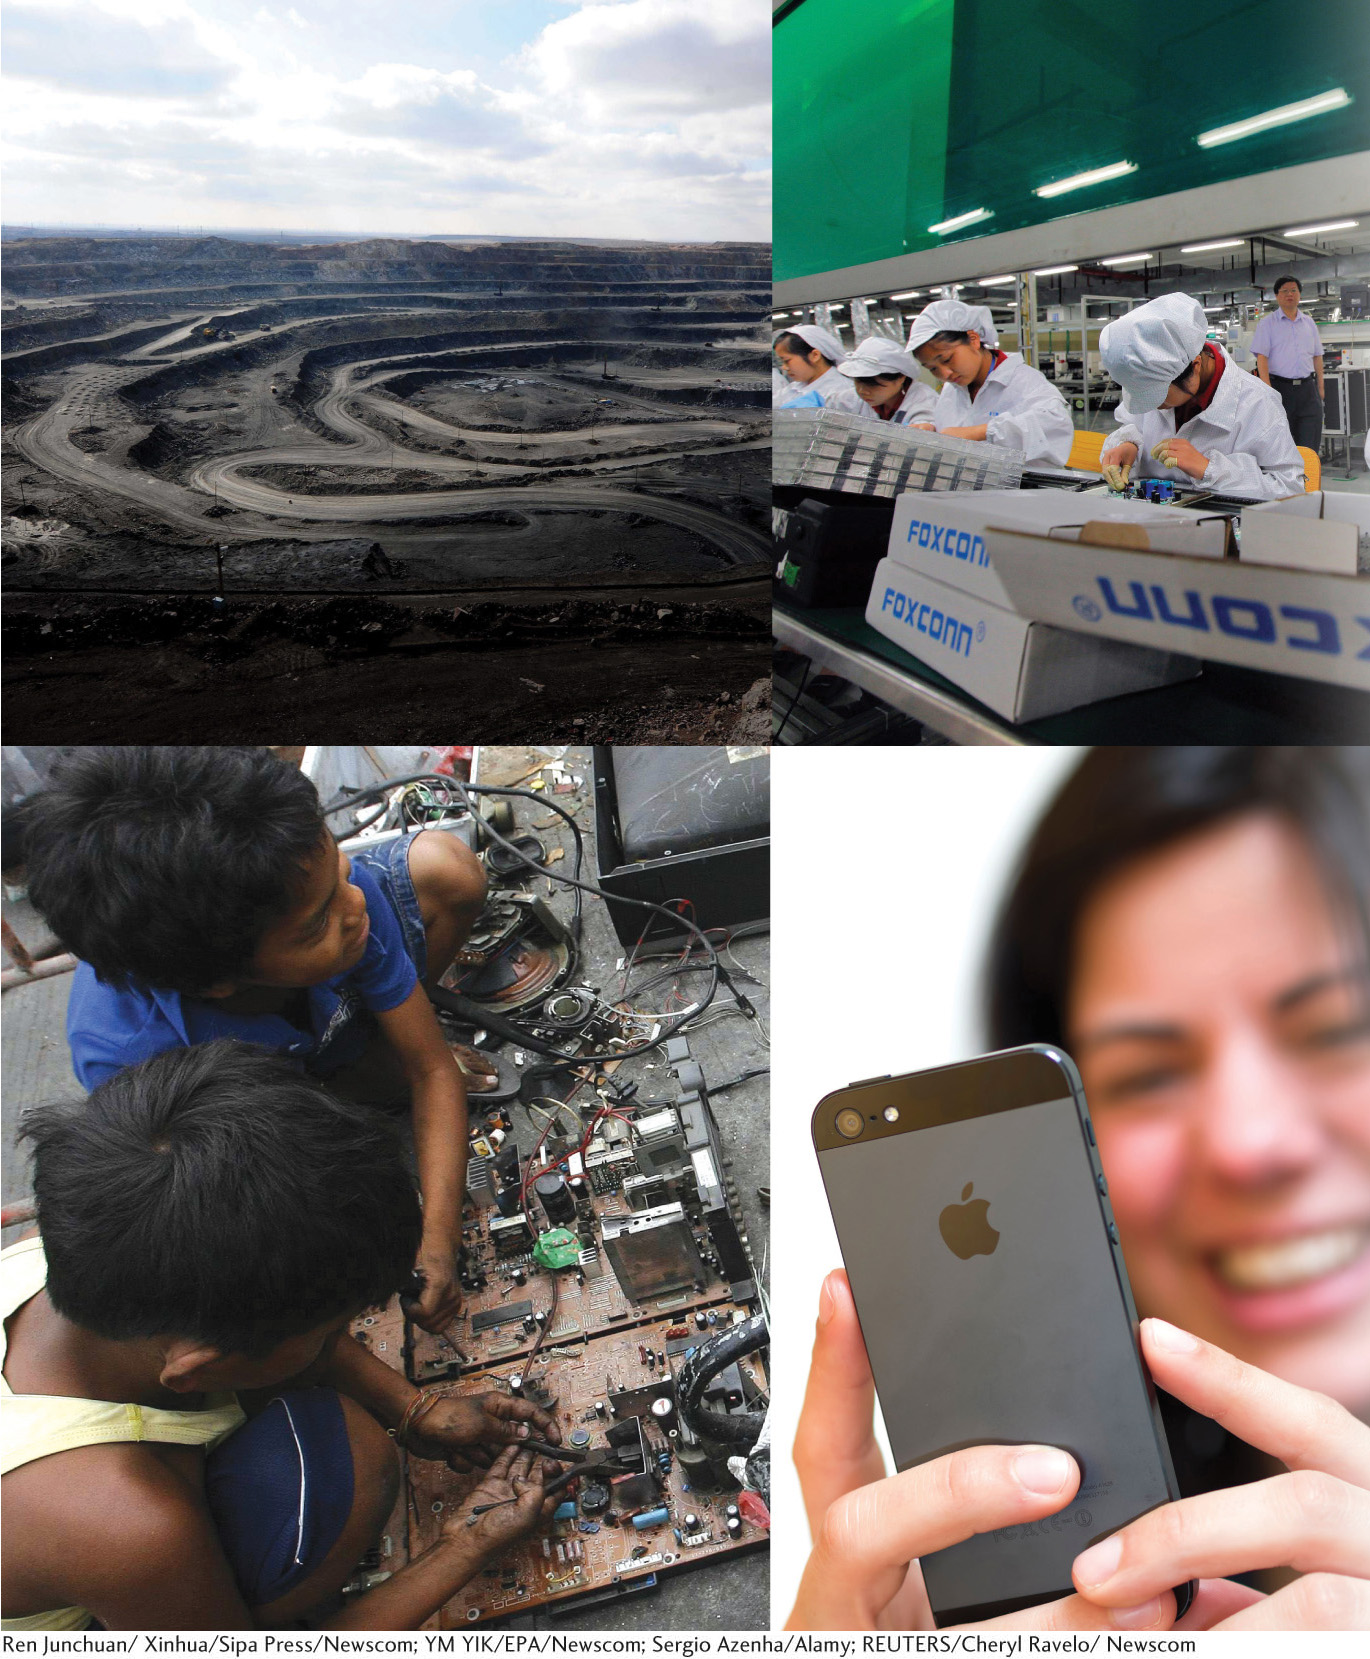
Have you ever wondered where your smartphone started its life, and where it will go when it dies?
Clockwise from top left: China’s Mongolia mining region; Foxconn workers assembling smartphones; using the latest iPhone; children sifting through electronic waste in Manila, Philippines.
(Ren Junchuan/Xinhua/Sipa Press/Newscom; YM YIK/EPA/Newscom; Sergio Azenha/Alamy; REUTERS/Cheryl Ravelo/Newscom.)
Go to “Seeing Geography” to learn more about this image.
367
LEARNING OBJECTIVES
▪9.1
Discuss the history of development and how it has shaped, and reshaped, regions.
▪9.2
Specify the ways in which mobilities of various sorts—of individuals as well as things and ideas—are important for development.
▪9.3
Identify how formerly poor places are today significant agents of development.
▪9.4
Recognize the role that nature has played over time as concepts and practices of development have changed.
▪9.5
Observe how development projects have shaped the landscapes around us.
Being “developed” as opposed to “underdeveloped” is typically understood as primarily an economic issue. Wealthy places are considered to be developed, whereas poor places are labeled as underdeveloped. Indeed, the key terms relating to development geography have traditionally been economically based. The most common measure of development, for instance, is Gross Domestic Product, or GDP. Gross Domestic Product totals the dollar value of all goods and services produced in a country over a specific period, usually a year. The map shown in Figure 9.1 shows the vast disparities in GDP from country to country.
Gross Domestic Product (GDP)
The total dollar value of all goods and services produced in a country over a specific period, usually a year.
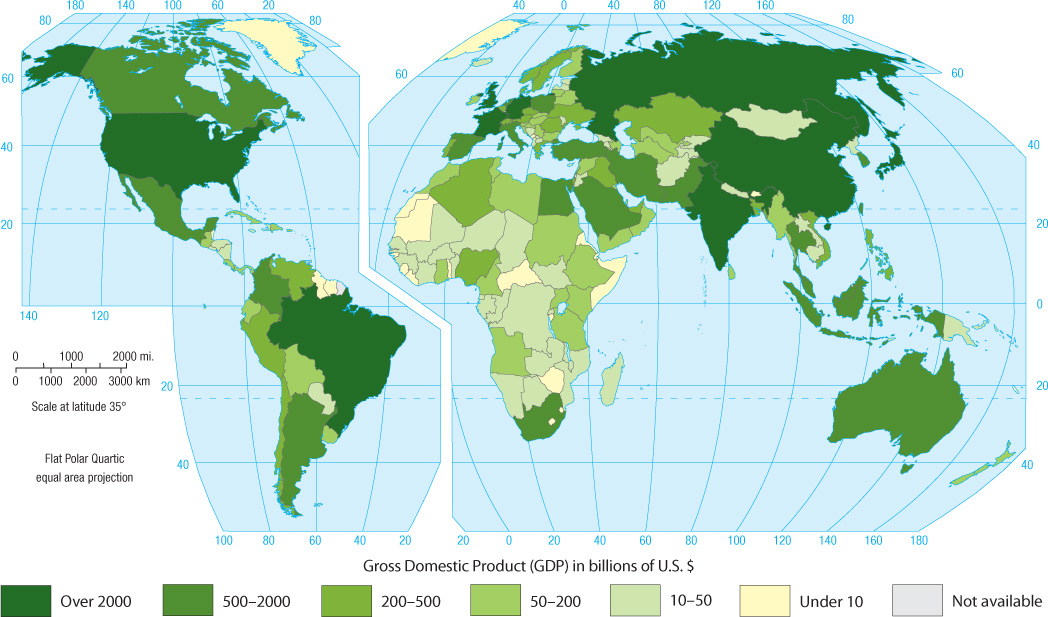
What do those differences really mean? In fact, not much can be inferred from GDP numbers except that some countries have economies that are far larger—and thus produce more total goods and services—than the economies of other countries. For instance, Brazil’s economy, as measured by the total value of goods and services produced annually, is the seventh largest in the world. It is approximately 10 times the size of Chile’s economy. Is the average Brazilian 10 times richer than the average Chilean? Ten times more productive? Not so fast. Comparing Brazil’s GDP to Chile’s is hardly fair. Chile’s population is only about 8 percent of Brazil’s. So, it is understandable that far more populous Brazil can produce more total goods and services in a year than Chile.
368
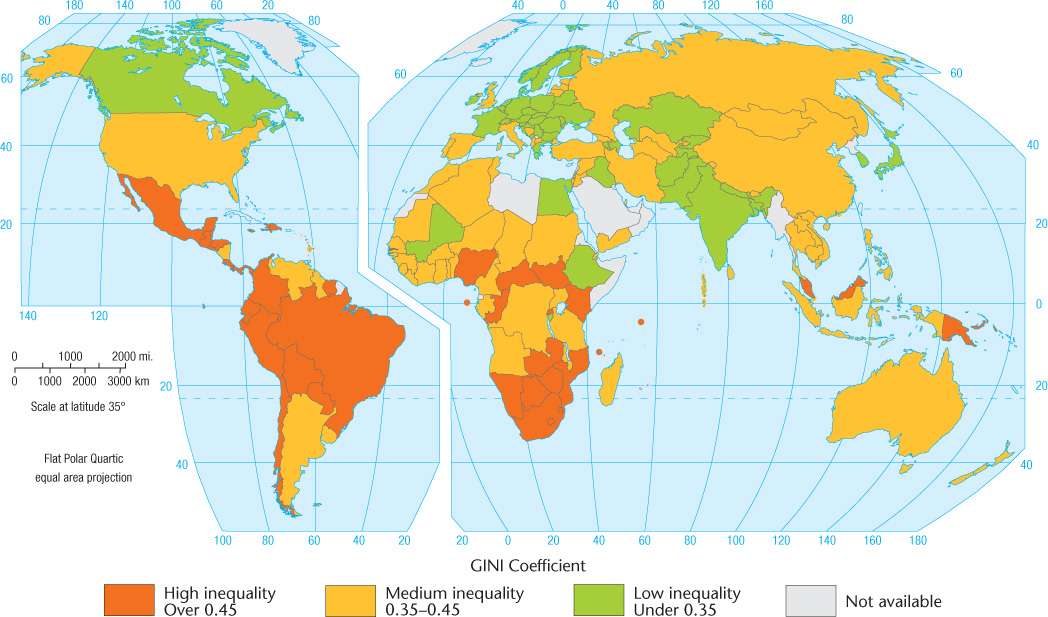
How then can we compare apples to apples—in this case, the share of GDP that corresponds to each Brazilian or Chilean resident? To do that, we need to divide GDP by the national population, which gives the GDP per capita. GDP per capita provides a crude way to compare how wealthy or poor the “average” Brazilian or Chilean may be. In our example, Chile’s GDP per capita—which in 2012 was measured at $15,410—was actually larger than Brazil’s at $12,079. Figure 9.2 shows GDP per capita figures globally. Now you can begin to assess how different nations stack up against one another in terms of their per capita economic production, bearing in mind that GDP per capita figures cannot demonstrate how incomes are actually distributed across national populations. Brazil, for instance, is notoriously unequal in its income distribution. (For a measure of income inequality, see Figure 9.3.)
GDP per capita
The mathematical result of dividing a country’s GDP by its national population. (The Latin per capita means “per head”)

It is certainly true that without sufficient economic resources, societies are unable to provide for their citizens. But—to put it crudely—is money all there is to development? Or, to turn this question around, does having monetary resources necessarily mean that societies will choose to spend those resources to improve the well-being of their populations?
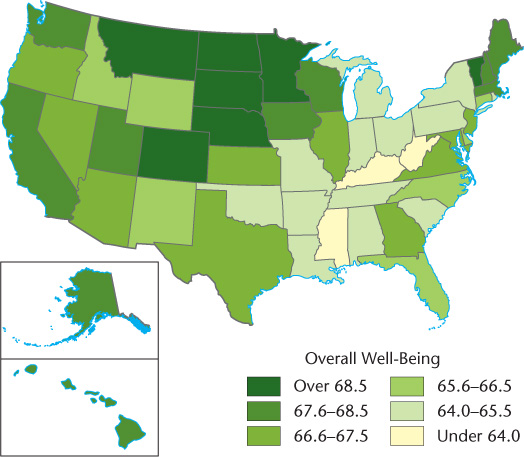
Development geographers and others who study such questions largely agree that development is indeed about more than just money. Development is, at its heart, a much more encompassing idea: it is about enhancing individual and societal quality of life. To paraphrase the great Indian leader Mahatma Gandhi, development is about each human being’s ability to reach his or her full positive potential. In a material sense, we can understand development as the fulfillment of basic needs for food, clean water, adequate shelter, and clothing. Some understandings of basic needs add education, health care, and sanitation to this list. Figure 9.4 shows a world map of the Human Development Index, or HDI, which is a traditional measure of how well people’s basic needs are being met, while Figure 9.5 takes a closer look at well-being in the United States. (See also the discussion of HDI in Chapter 1.)
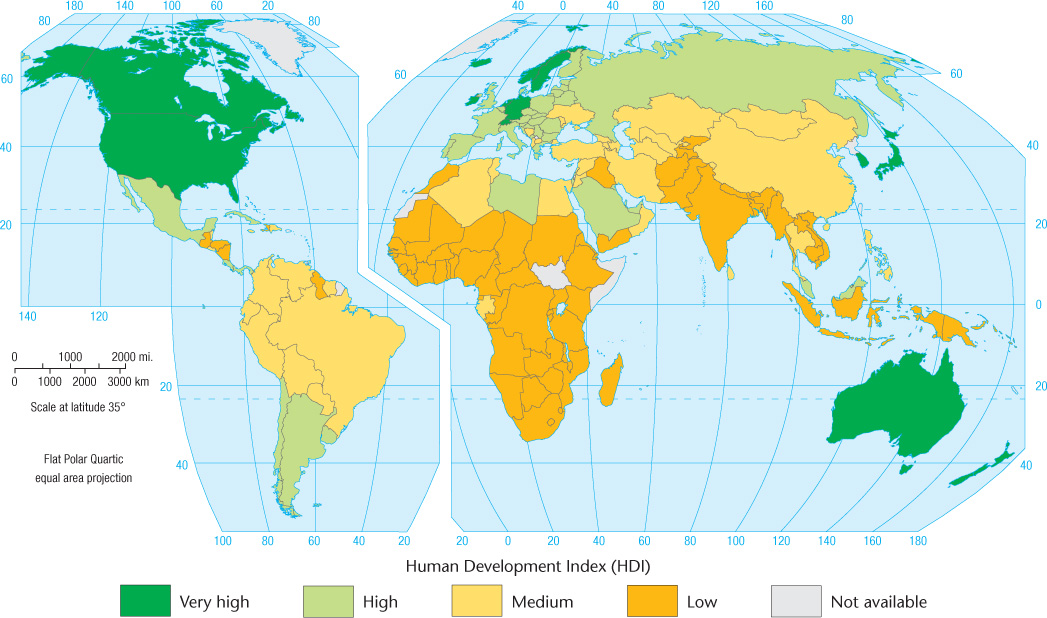
Human Development Index (HDI)
A numerical value devised by the United Nations Development Programme that is used to measure how well basic needs are being met. It is a composite index, derived from three areas: life expectancy, education, and income.
369
Although access to a certain baseline amount of economic resources is necessary in order to fulfill these basic needs, merely having the economic means to provide them is no guarantee that basic needs will, in fact, be met for all members of society. The principal allocators of such resources—in most nations, that is governments, corporations, and nongovernmental entities such as churches and foundations—may choose to direct economic resources to other areas. For instance, purchasing military equipment and funding armies may be a higher priority than making sure basic human needs are met. Or, some form of prejudice—for instance, discrimination by gender, religion, age, race, sexuality, or ethnicity—may exist, such that only some members of society have their basic needs met while others systematically do not. For their part, individuals simply may not have sufficient economic resources to meet their own basic needs or those of their dependent family members. And, as with larger entities such as governments or corporations, individuals may choose to direct their economic resources in ways that do not fulfill their basic needs; for instance, forgoing medical care in order to gamble.
370
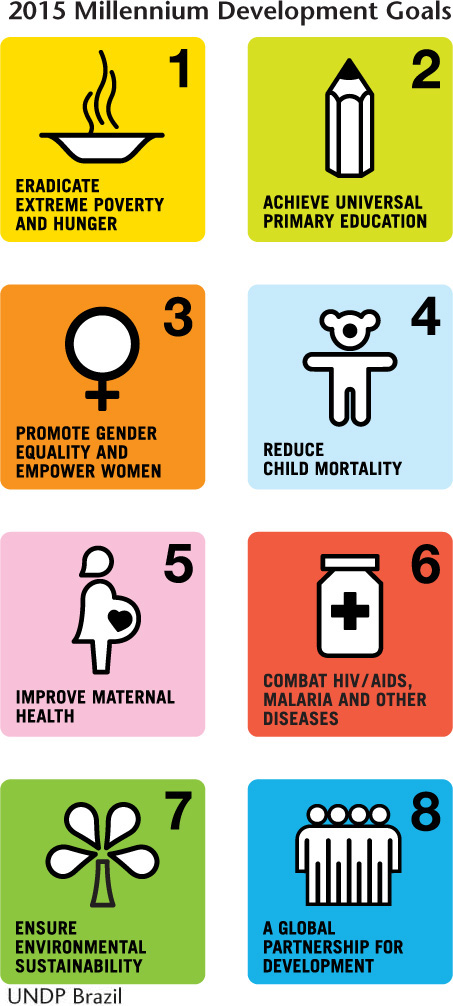
In 2000 the United Nations alongside other international development agencies established eight Millennium Development Goals. As you can see in Figure 9.6, some of these—eradication of extreme poverty and hunger (Goal 1), for example—are focused on basic needs. Other goals, such as promoting gender equality and empowering women, are broader in scope. In retrospect, these goals were probably too ambitious and broad for all participating nations to achieve: in practice, the results have been uneven. Yet, the Millennium Development Goals did offer a bold and sweeping statement on the universal elements of a dignified, comfortable, and productive human existence.
Thinking beyond the material, social, and infrastructural dimensions of development for a moment, what other conditions might be important for a place to be considered truly developed? Development economist Amartya Sen has proposed that freedom lies at the heart of development. Sen intends for freedom to be interpreted as encompassing political and civic freedoms, as well as freedom from the vulnerabilities (such as illiteracy, or early death) associated with poverty. Geographers might add to this notion of development the freedom to move about without restrictions.
371
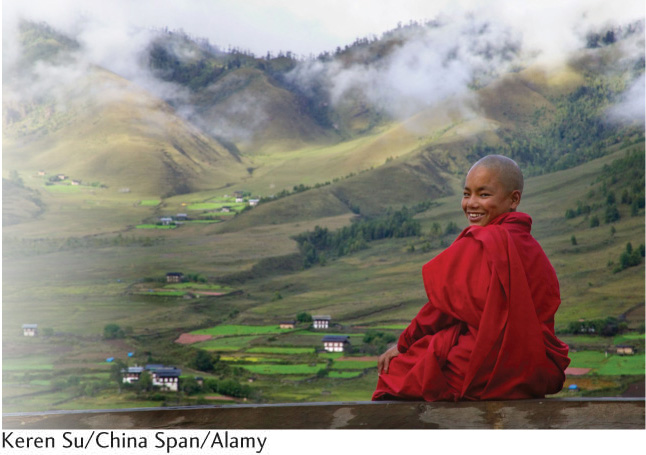
In the 1970s, the king of Bhutan coined the term Gross National Happiness index to counter what he viewed to be an overly economy-centered approach to development taken by Western nations (Figure 9.7). Instead, he proposed that happiness was also an important part of development, and that it, in fact, could be measured. Not surprisingly, the nation of Bhutan, while poor, ranked very high on the Gross National Happiness index. Cultural and ecological diversity, good governance, and psychological well-being are some of the elements included in the Gross National Happiness index. These values resonate within Bhutan’s Buddhist culture (see Chapter 7), while not being exclusive to Buddhism. It is important to note, however, that Bhutan’s government has been sharply criticized for its oppression of ethnic minorities, which brings into question its “happiest place” designation (Figure 9.8).

372
As you can see, development geography has a firm foundation in economic well-being, but it is hardly limited to monetary measures. In this chapter, we will explore the history and contemporary profile of development geography, in order to gain a sense of how important development is to human well-being across the globe.