23.1 The Economics
of Resources 23

- 23.1 Growth Models for Biological Populations
- 23.2 How Long Can a Nonrenewable Resource Last?
- 23.3 Radioactive Decay
- 23.4 Harvesting Renewable Resources
- 23.5 Dynamical Systems and Chaos
How many people will there be in the world when you retire? Will there be any oil left by then? Will there be any fish left?
In this chapter, we explore the growth and decline of populations, such as populations of people, barrels of oil, and fish. How long can a nonrenewable resource last us?
In Chapters 21 and 22, we explored mathematical models for saving, accumulating, and borrowing—the building up of resources. In this chapter, we model processes in the other direction—the use, decay, depletion, and spending down of resources, even resources that tend to replenish themselves regularly.
The Formulas We Use in This Chapter 23.1
23.1
We use here only three formulas from Chapter 21, “Savings Models,” specialized to an annual interest rate r and number of years n (formerly t). We change our perspective from a t that could be any amount of time to a number n of years, because populations of resources and animals are usually tallied on an annual basis:
Compound interest formula (page 875): If a principal P is deposited into an account that pays interest at rate r per year, then after n years the account contains the amount
An=P(1+r)n
Savings formula (page 884): For a uniform deposit of d per year (deposited at the end of the year) and an interest rate r per year, the amount A accumulated after n years is
An=d[(1+r)n−1r]
Continuous interest formula (page 882): For a principal P in an account at a nominal annual rate r, compounded continuously, the balance after n years is
An=Pen
If you understand and can use these formulas, you can proceed in this chapter without first reading Chapter 21 or Chapter 22.
We begin with a geometric growth model for human populations, applying it to the current U.S. population. Limits to growth of any population lead us to the logistic model, which takes into account the carrying capacity of the environment. Surprisingly, such a model applies also to the spread of a technology or new product.
We then calculate how long a nonrenewable resource, such as oil, can last at a current rate of use and also at a constantly increasing rate of use; and we show how the logistic model fits well the history of oil consumption.
In the case of renewable resources, such as forests and fisheries, we examine how the growth curve determines potential equilibrium population sizes and what harvesting policies can produce yields that are sustainable year after year.
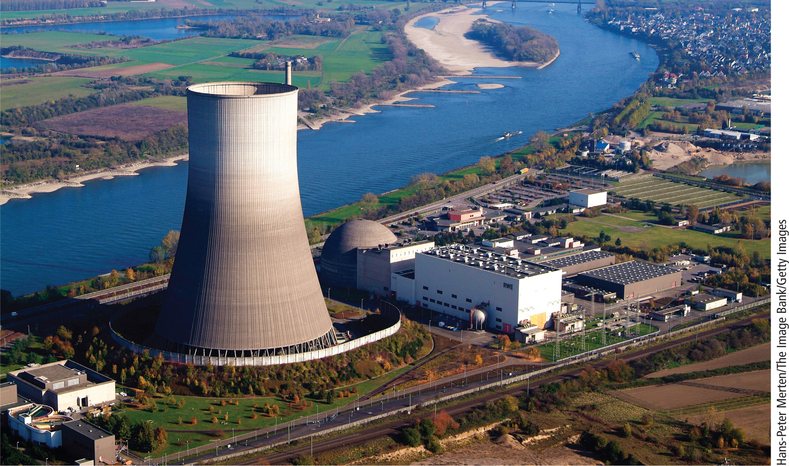
There are some resources, such as nuclear waste, that decay and we want to become exhausted. How long will it take until Fukushima, Japan, or Chernobyl, Ukraine, is inhabitable again?
Economic factors influence harvesting efforts and consequently the population of the resource. But even biologically and economically sound policies are subject to the unpredictability of weather and other factors. What’s worse, as we will see, even in the absence of chance effects, the dynamics of a population can vary in an apparently chaotic fashion—even to extinction.
Spotlight 23.1 reviews the formulas that will be used in this chapter.