4.3 Global Atmospheric Circulation Patterns
Illustrate global patterns of atmospheric pressure, winds, and precipitation.
When Earth is viewed from space, there does not seem to be a geographic pattern to the distribution of clouds and cloud-
Global Pressure Systems
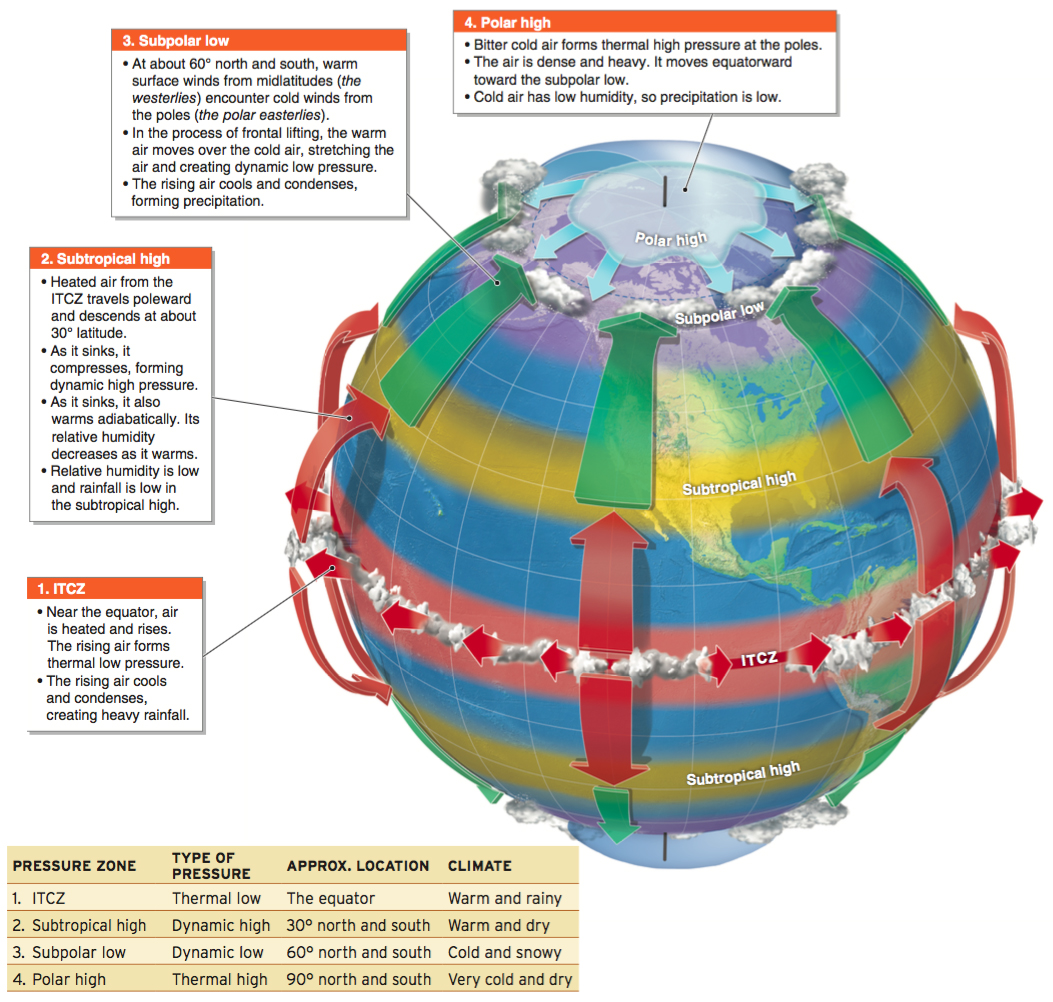
Earth’s global pressure systems are the ITCZ, the subtropical high, the subpolar low, and the polar high. In the tropics, intense sunlight heats land and ocean surfaces during the day. As we saw in Section 2.1, that heating is strongest at the subsolar point. The heated surfaces, in turn, heat the air above them, creating a global band of unstable, buoyant air parcels that roughly tracks the migration of the subsolar point. This band, which is called the ITCZ, or intertropical convergence zone, results in thunderstorms and heavy precipitation (see Section 3.3).
ITCZ
(or intertropical convergence zone) A global band of unstable, buoyant air parcels that tracks the migration of the subsolar point.
The unstable air of the ITCZ rises as far as the tropopause (the base of the stratosphere). Because of the temperature inversion in the stratosphere, rising air parcels become stable at about 16,000 m (52,500 ft) in altitude as they encounter warm air at the tropopause (see Section 1.3). Thus the ascending air begins moving poleward because it cannot move into the stratosphere.
As the air moves poleward, Coriolis force causes the air to deflect eastward. This causes the wind to slow down and pile up. As a result, some of the air is redirected downward to Earth’s surface at about 30° latitude.
As the air descends at 30° latitude, it is compressed and warmed adiabatically (see Section 3.3). This compression creates an area of high dynamic pressure called the subtropical high, a discontinuous zone of high pressure and aridity made up of anticyclones roughly centered on 30° north and south latitude.
subtropical high
A discontinuous belt of aridity and high pressure made up of anticyclones roughly centered on 30° north and south latitude.
The subpolar low is a discontinuous band of low pressure, centered on 60° north and south, made up of cyclonic systems that bring frequent precipitation due to frontal lifting (see Section 3.3). The cold and dense air at each pole forms an area of thermal high pressure called the polar high. The dry air of the polar high creates polar deserts. This global pattern of pressure systems is illustrated in Figure 4.14.

subpolar low
A belt of low pressure roughly centered on 60° north and south and made up of cyclonic systems that bring frequent precipitation.
polar high
An area of cold, dense air at each pole that forms a zone of thermal high pressure.
Global Surface Wind Patterns
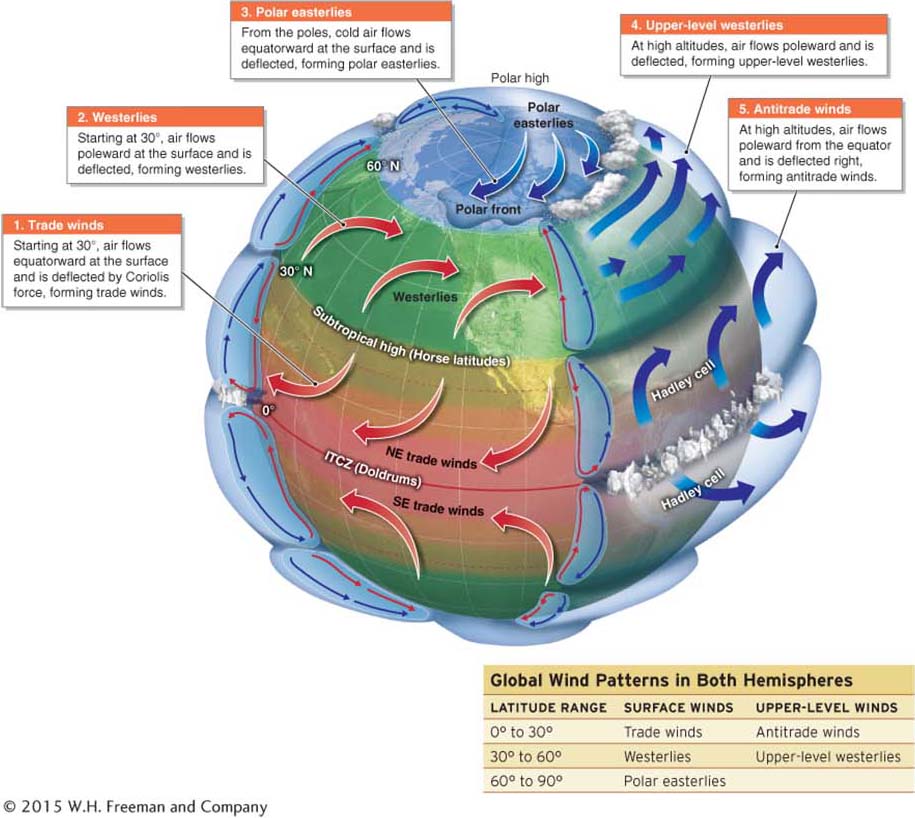
Earth’s major surface wind patterns result from the pressure systems we have just described. Coriolis force also plays a key role in the direction surface winds travel. The trade winds are the most geographically extensive and consistent winds on Earth’s surface. Trade winds form because Coriolis force deflects air flowing from the subtropics to the equator westward, as shown in Figure 4.15. Trade winds are easterly surface winds found between the ITCZ and the subtropical high. Early trade between Europe and Africa and the Americas was made possible by these winds, and their name is derived from this history. In the Northern Hemisphere, they are called the northeasterly trade winds. In the Southern Hemisphere, they are the southeasterly trade winds. As the trade winds travel to the equator from the subtropical high, they form a circulation loop called a Hadley cell.
trade winds
Easterly surface winds found between the ITCZ and the subtropical high, between 0° and 30° north and south latitude.
The doldrums are a low-
doldrums
A low-
horse latitudes
The low-
Picture This
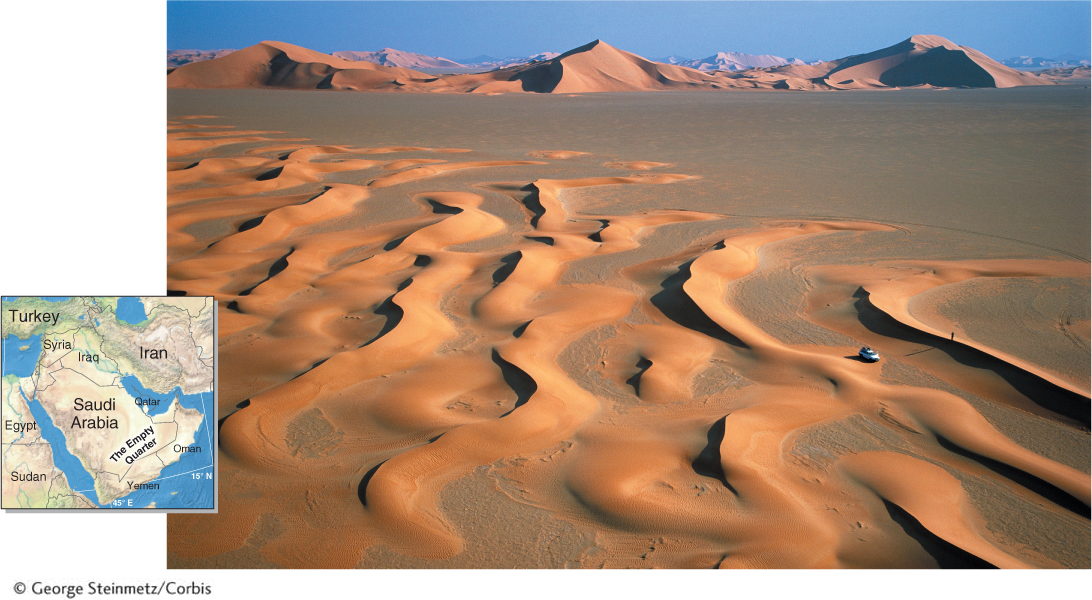
The Empty Quarter
The Empty Quarter, or Rub‘ al Khali, of the southeastern Arabian Peninsula, is located between 16° and 23° north latitude. It is Earth’s largest sand desert. It covers nearly 650,000 km2 (250,000 mi2) and stretches from Saudi Arabia into Yemen, Oman, and the United Arab Emirates. Some sand dunes rise 250 m (820 ft) above the surrounding desert floor. (Notice the Range Rover in the middle right foreground for scale.) The sand dunes are estimated to have been active for over a million years. Between 9,000 and 6,000 years ago, the climate of the region was wetter, and many permanent lakes formed. Large amounts of sand were deposited in these lakes. Subsequently, increased aridity due to natural climate change dried the lakes, and the sand in them was freed, forming the migrating dunes that we see today.
Consider This
Question 4.3
Based on what you have learned in this chapter up to this point, explain why the Empty Quarter is so arid.
Question 4.4
What do you think happened to the strength and position of the subtropical high in this region about 9,000 to 6,000 years ago? Explain.
The westerlies are surface winds, found in both hemispheres between the subtropical high and the subpolar low, that blow from the west. They form as the descending air of the subtropical high flows poleward along the surface and is deflected by the Coriolis force. In a similar manner, the polar high exports cold, dense air equatorward. Coriolis deflection creates polar easterlies that are cold and dry.
westerlies
Surface winds that come from the west and are found in both hemispheres between the subpolar low and the subtropical high.
polar easterlies
Cold, dry winds originating near both poles and flowing south and east.
 The trade winds and westerlies will have an important role to play in the growing technology of wind power because they occur where there are large human populations in need of energy. The Geographic Perspectives in Section 4.5 explores the role of wind power production in addressing human energy needs.
Upper-
Upper-
An intermittent fast band of wind called the subtropical jet stream is centered on 30° latitude in both hemispheres. Similarly, a high-
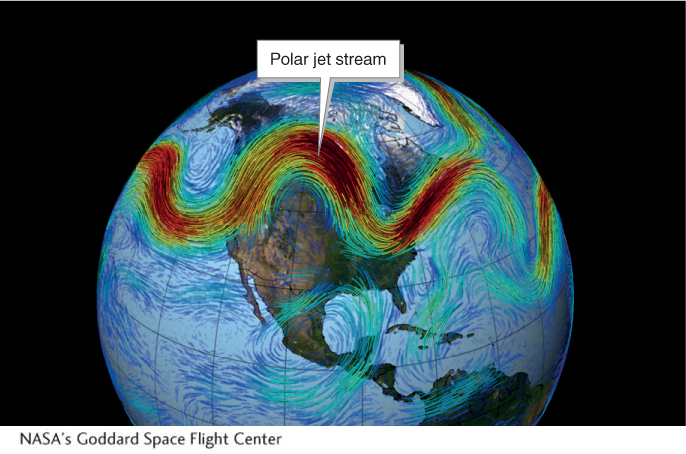
polar jet stream
A discontinuous narrow band of fast-
The sharp temperature contrast that occurs near 60° latitude (at the subpolar low) causes a sharp north–
The subtropical jet stream can also play an important role in storm strength and moisture transport. The subtropical jet stream is situated over the subtropical high, at approximately 30° north and south. The direction of flow of both the polar jet stream and the subtropical jet stream follows Rossby waves (also called longwaves), large north–
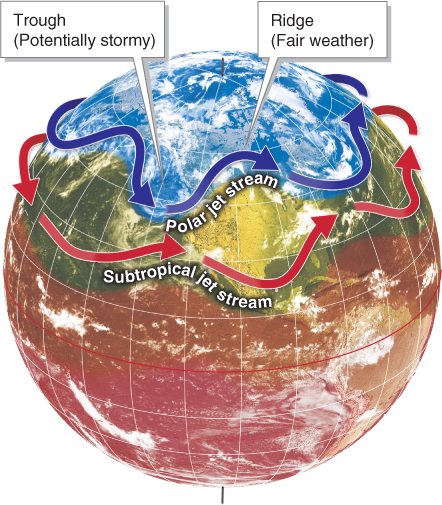
Rossby wave
(or longwave) A large undulation in the upper-
Rossby waves
(or longwave) A large undulation in the upper-
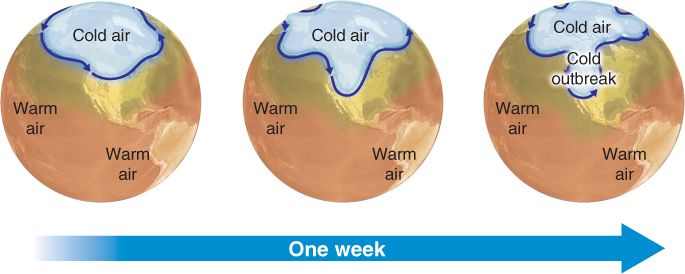
There are always three to six Rossby waves in the Northern Hemisphere polar jet stream. They are seldom stationary, but continually change their geographic position and depth. Rossby waves are also part of the global heat engine discussed in Section 2.5. As they bend north and south, Rossby waves provide meridional heat transport from the equator to the poles. In so doing, they export surplus heat from the tropics and deliver it to higher latitudes. Figure 4.18 illustrates how cold outbreaks occasionally occur as a Rossby wave trough deepens, is pinched off, and moves southward.
Seasonal Shifts of Global Pressure
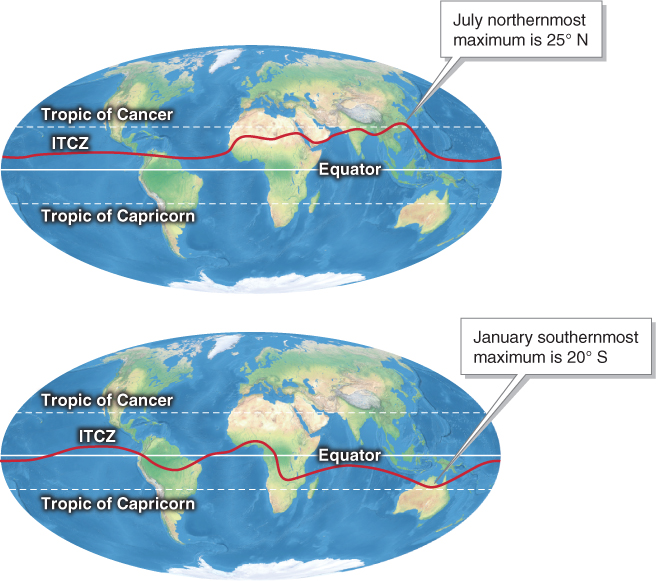
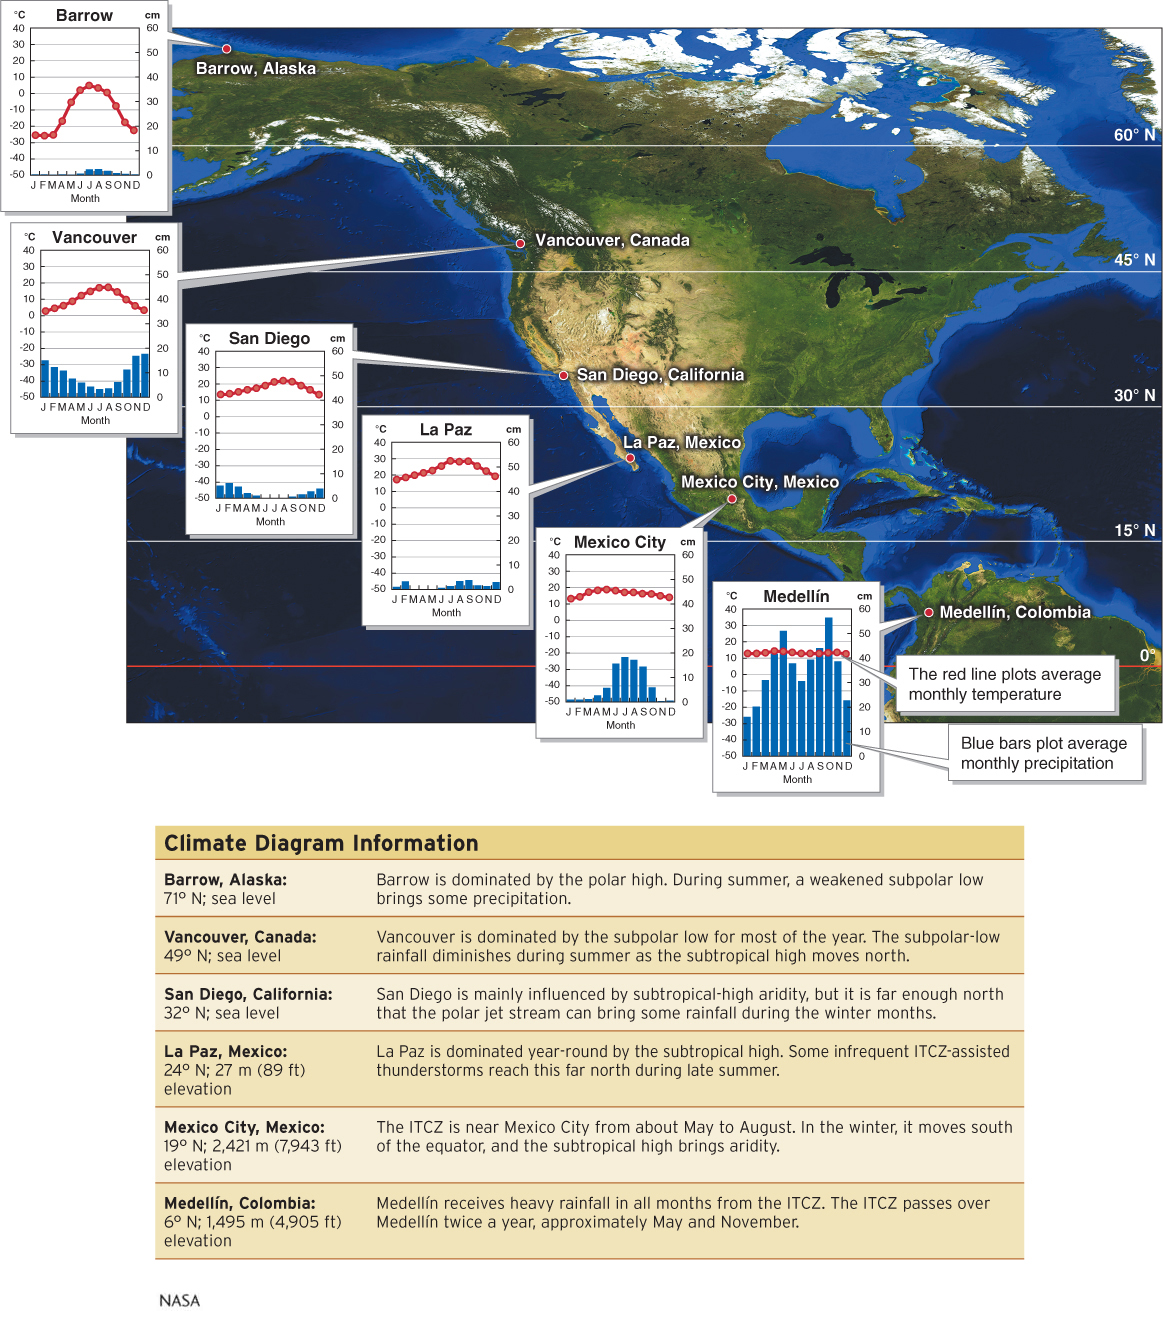
Seasons have an important influence on the global pattern of pressure systems and winds. We have referred to global pressure systems as being centered and fixed on key lines of latitude. For instance, the ITCZ was portrayed in Figure 4.14 as lying on the equator. However, the ITCZ shifts its latitude as it tracks the subsolar point (see Section 2.1). Generally, the latitude of the ITCZ shifts with the latitude of the subsolar point (Figure 4.19), and the other global pressure systems shift with it.
In the Northern Hemisphere, as the ITCZ moves northward in summer, it brings heavy precipitation to Central America and into Mexico. As one travels farther north in Mexico and leaves the influence of the ITCZ, the climate becomes progressively more arid. The subtropical high and the subpolar low also move north and south with the ITCZ’s movement. Therefore, the midlatitudes experience a marked seasonal contrast in weather patterns: They are affected by the subtropical high in summer and by the subpolar low in winter.
Global precipitation and, consequently, vegetation patterns are mainly controlled by the global pressure systems (see Section 8.1). As one moves outside the tropics, the general pattern of summer rainfall from the ITCZ is gradually replaced by winter precipitation from the subpolar low, as shown in Figure 4.20 below.
Question 4.5
Why are tropical rainforests always wet?
It is rainy in the tropics because the ITCZ brings frequent rainfall.
The precipitation pattern shown in Figure 4.20 generally holds true for much of the world, but there are many exceptions. The windward sides of mountain ranges, for instance, are typically much wetter than surrounding lowlands, regardless of their latitude, due to precipitation resulting from orographic lifting (see Section 3.3). Their leeward rain-
The Influence of Landmasses
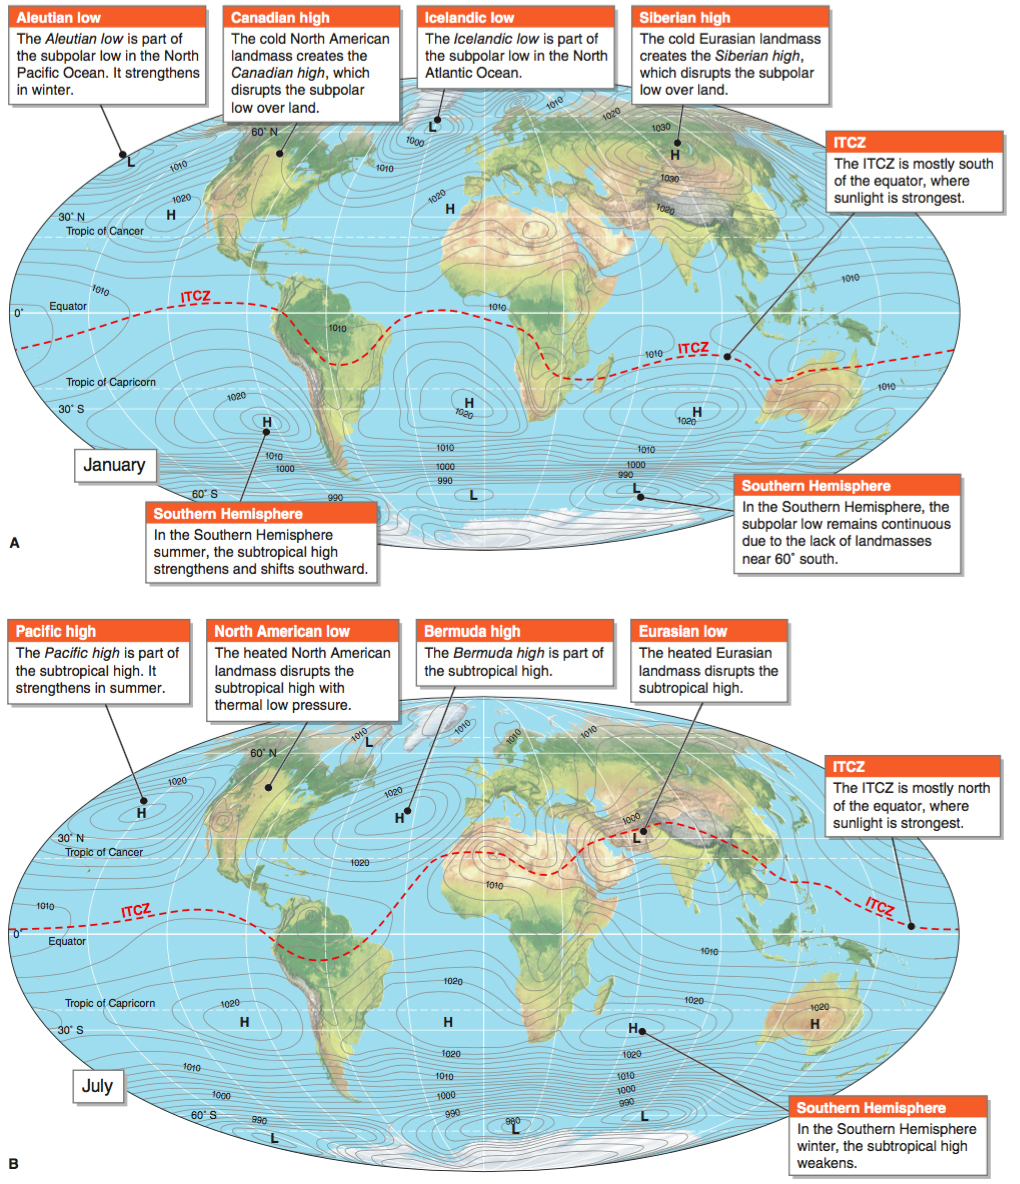
Continental landmasses play an important role in global atmospheric circulation and precipitation. As you may recall from Section 2.3, land has a lower specific heat than seawater. Therefore, relative to the oceans, continental landmasses become hotter during the summer months and colder during the winter months.
This seasonal heating and cooling creates thermal low-
Question 4.6
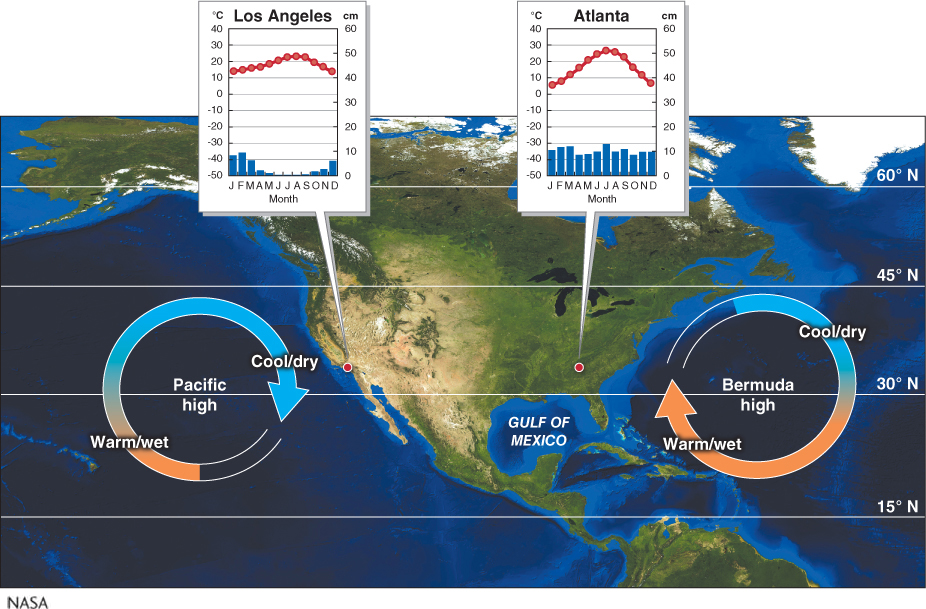
Why is southern California so dry and Georgia so wet in summer when both are at the same latitude?
The Bermuda high brings warm and humid air to Florida from the south during summer. The Pacific high brings cool and dry air from the north to southern California during summer.
At a larger spatial scale, we can examine North America in more detail. In summer, the East Coast of the United States is humid, but the West Coast is relatively arid. This pattern is due to the influence of the Bermuda high and the Pacific high. The Bermuda high is a semipermanent anticyclone in the western Atlantic, and the Pacific high is a semipermanent anticyclone in the eastern Pacific. Both systems are part of the subtropical high pressure belt (Figure 4.22).