GT.4 Imaging Earth
Discuss how technologies such as satellite sensors and radar are used to study and portray Earth systems and processes.
Remote sensing technologies, such as satellites and radar, collect data from a distance. Remote sensing is an important means of acquiring data to study the physical Earth. Passive remote sensing refers to the process of receiving information from Earth’s surface using sensors, much as our eyes receive information about our surroundings. In active remote sensing, a signal is sent using a transmitter. The signal bounces off a surface and returns to the sender, where a receiver detects the reflected signal.
Satellite Imagery
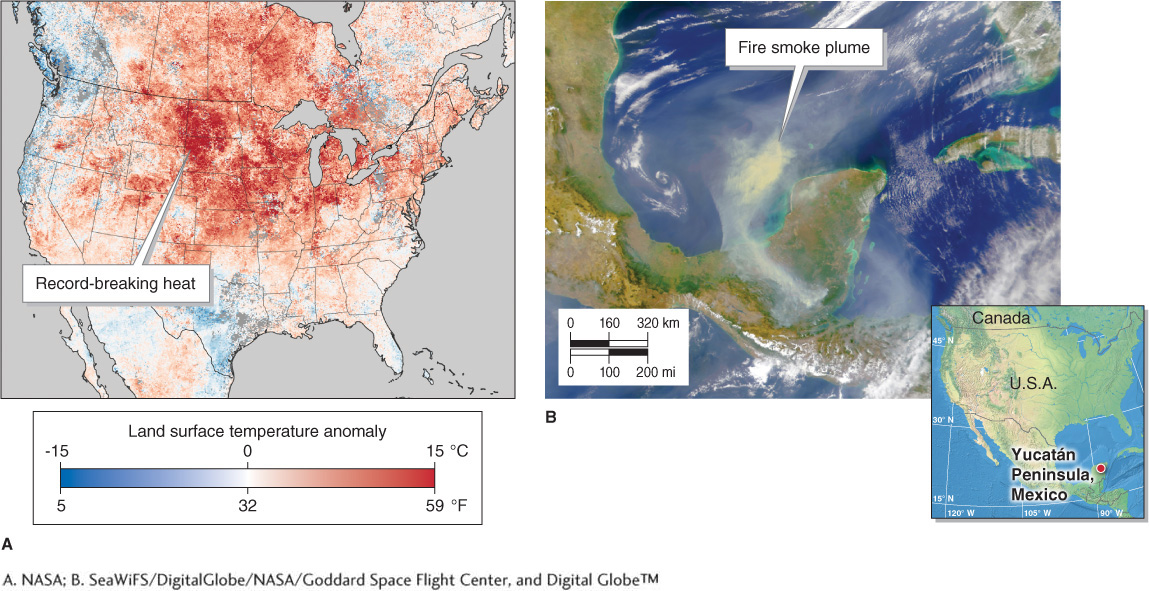
Satellite remote sensing is one of the most important means of acquiring data used to monitor Earth’s physical systems. Satellites have revolutionized our ability to monitor Earth’s rapidly changing surface. No other generation has had so much Earth science data so freely available, and satellite remote sensing is largely the reason.
remote sensing
Data collection from a distance.
Just as a digital camera creates images using electronic sensors rather than photographic film, satellites often use passive electronic sensors to create digital images of Earth’s surface. The sensors on satellites, however, are far more advanced in their capabilities. Personal digital cameras can sense only visible light, which is light that we can see with our eyes. Sensors on orbiting satellites are also able to sense other forms of energy that are invisible to us, such as heat radiation from Earth’s surface. Satellite remote sensing provides many of the images used in this book. Figure GT.26 provides examples of some of the applications of satellite remote sensing.

Radar and Sonar
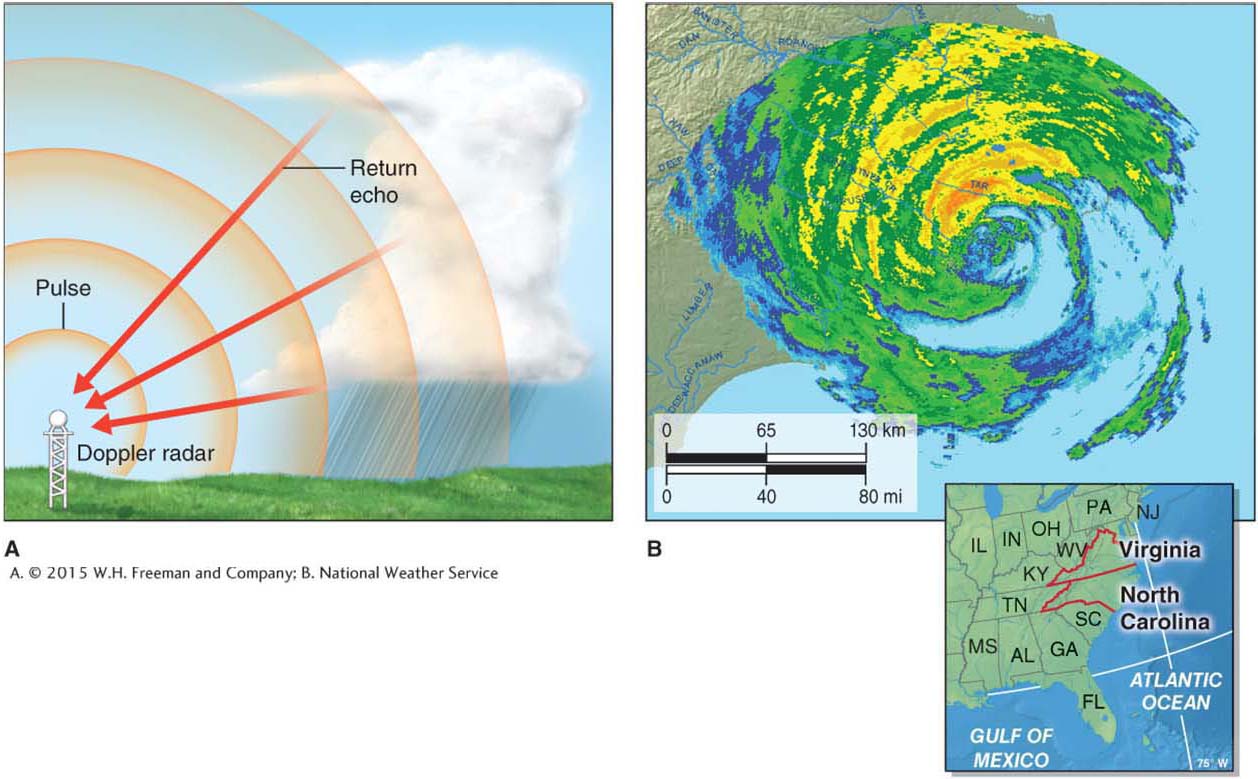
Radar (short for radio detection and ranging) is an important active remote sensing technology. Doppler radar is an active remote sensing technology widely used in the study of the atmosphere. Doppler radar uses microwave energy to measure the velocity and direction of movement of particles of precipitation within a cloud. Figure GT.27 provides a Doppler radar image of Hurricane Irene (2011) as an example.
Doppler radar
An active remote sensing technology that uses microwave energy to measure the velocity and direction of movement of particles of precipitation within a cloud.
Radar is also used to image the surface of Earth. Radar technology provides detailed images of surface relief that cannot be easily detected using photography or satellite imagery. Radar transmitters mounted on airplanes send a pulse of radio waves at an angle and receive the return signal reflecting off Earth’s surface. LIDAR (light detection and ranging) is a relatively new type of remote sensing that uses light, rather than radio waves or microwaves, to image Earth’s surface.
Question 901.15
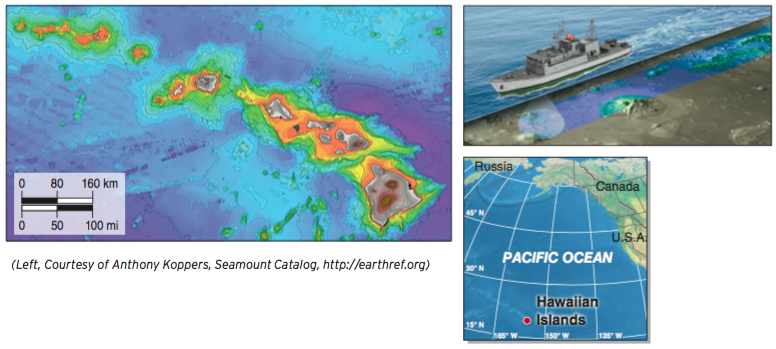
How do we know mountains are hidden deep in the ocean?
Sonar mapping allows scientists to image the seafloor by sensing reflected sound waves.
Another active remote sensing technique is sonar (sound navigation and ranging). Sonar has been invaluable in mapping features of the seafloor. Sonar works by sending a pulse of sound from a transmitter aboard a ship. The sound pulse reflects off the seafloor and back to a receiver on the ship. The reflected echoes are received and used to create a map of the seafloor (Figure GT.28).
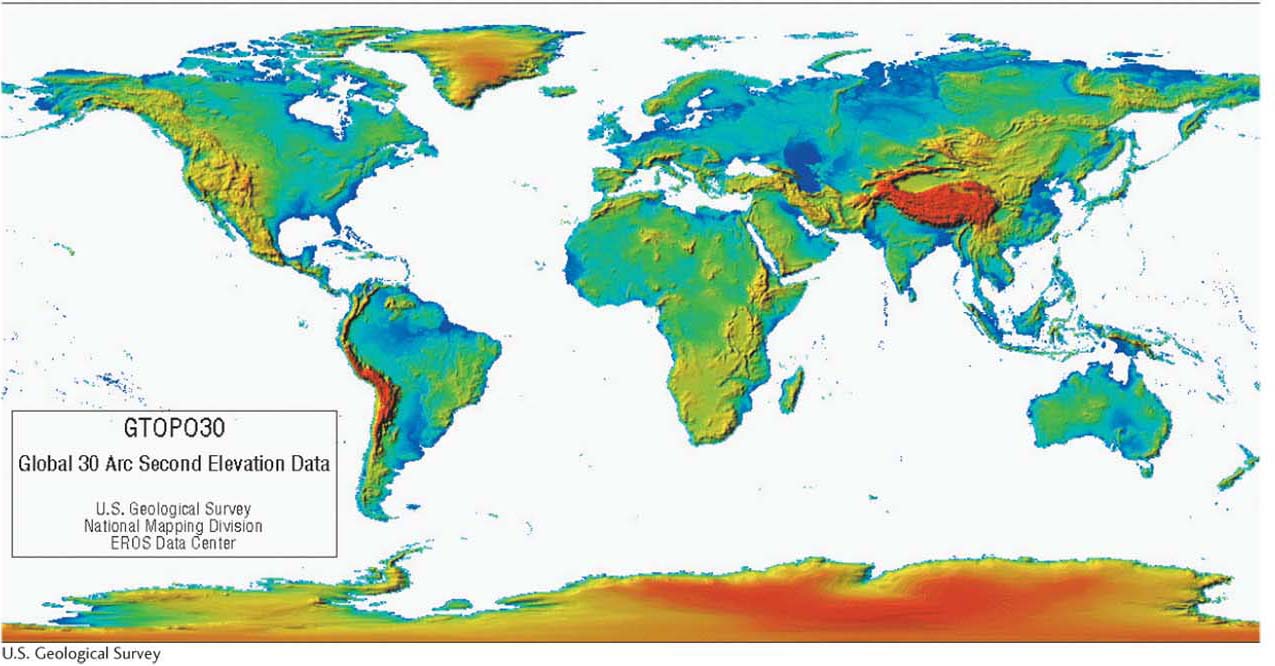
The remote sensing technologies described above can be used to create a digital elevation model (DEM). A DEM is a digital representation of land surface or underwater topography. DEMs are particularly effective at portraying Earth’s surface relief (Figure GT.29).
digital elevation model (DEM)
A digital representation of land surface or underwater topography.
Geographic Information Systems
Once spatial data are acquired through remote sensing or other means, they can be manipulated using a geographic information system (GIS). A GIS uses computers to capture, store, analyze, and display spatial data. Unlike traditional maps, which display all layers of information at once and are static (unchanging) once they are made, GIS maps are interactive, and layers of information can be chosen for display. Map users can interact with the spatial data within the database and can continually refine the map to explore different questions. Like maps, a GIS provides visual tools to help users gain a better understanding of the spatial relationships among various phenomena.
geographic information system (GIS)
A system that uses computers to capture, store, analyze, and display spatial data.
Unlike maps, a GIS integrates stacked layers of spatial data into a single dynamic unit. Each layer has a specific purpose and makes a specific contribution to helping the analyst achieve his or her goals.
California is prone to many natural hazards, particularly fires. The areas at greatest risk of fire can be precisely located using a GIS by spatially relating factors such as soil moisture, vegetation, and degree of urbanization (Figure GT.30).
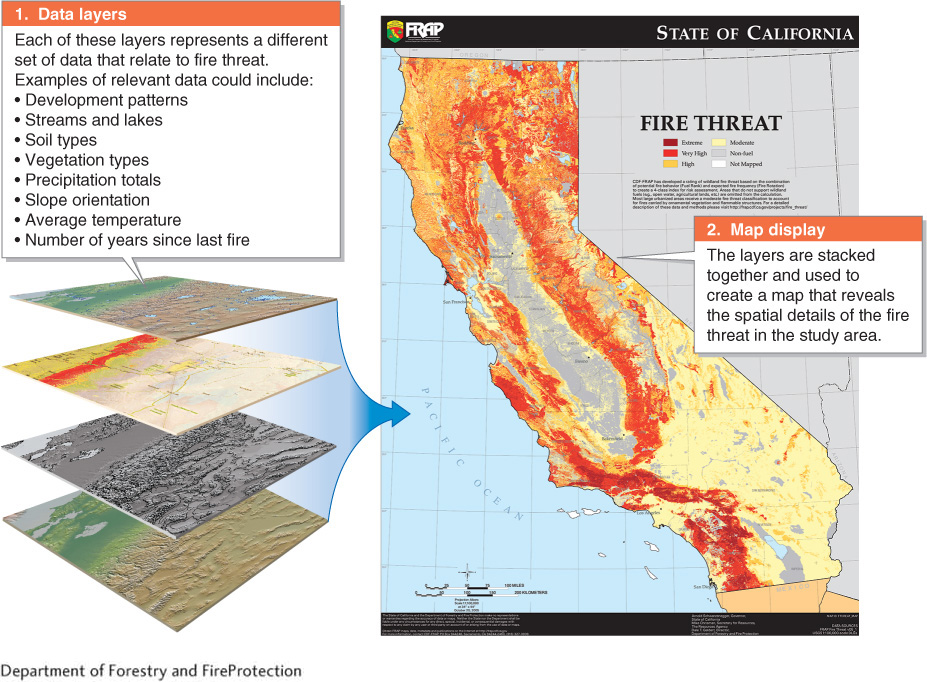
Once these areas are identified, homeowners, forest managers, and restoration ecologists, for example, can identify high-
GIS is one of the fastest growing fields in geography, and the field of GIS is rapidly developing in many public and private sectors of society as well. Landscape management, species conservation, water quality monitoring, fire management, and natural hazard zoning are just a few of the many applications of GIS. Many students who study geography and gain GIS skills are well prepared to go on to a career in a GIS-