Problems
(Solutions to problems marked * appear at the back of this book. Problems adapted to use calculus are available online at www.macmillanhighered.com/
One assumption of the supply and demand model is that all goods that are bought and sold are identical. Why do you suppose economists commonly make this assumption? Does the supply and demand model lose its usefulness if goods are not identical?
-
List the assumptions of the supply and demand model. Then, for each assumption, give one example of a market in which the assumption is satisfied, and one example of a market in which that assumption is not satisfied. Is it reasonable to use the supply and demand model when assumptions are violated?
The demand for organic carrots is given by the following equation:
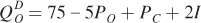
where PO is the price of organic carrots, PC is the price of conventional carrots, and I is the average consumer income. Notice how this isn’t a standard demand curve that just relates the quantity of organic carrots demanded to the price of organic carrots. This demand function also describes how other factors affect demand—
namely, the price of another good (conventional carrots) and income. Graph the inverse demand curve for organic carrots when Pc = 5 and I = 10. What is the choke price?
We begin with the demand equation and substitute the given values for PC and I:
QOD = 75 – 5PO + PC + 2I
QOD = 75 – 5PO + 5 + (2 × 10)
This simplifies to
QOD = 100 – 5PO
To find the inverse demand curve, we want to rearrange terms to express P as a function of Q:
5PO = 100 – QOD
PO = 20 – 0.2QOD
The choke price can be found by solving for the price that corresponds to a quantity demanded of zero:
PO = 20 – (0.2 × 0) = 20
Using the demand curve drawn in (a), what is the quantity demanded of organic carrots when Po = 5? When Po = 10?
Substitute 5 for PO in the demand function to find QOD:
QOD = 100 – 5PO = 100 – 5(5) = 75
Substitute 10 for PO in the inverse demand function to find QOD:
PO = 20 – 0.2QOD
10 = 20 – 0.2QOD
10 = 0.2QOD
50 = QOD
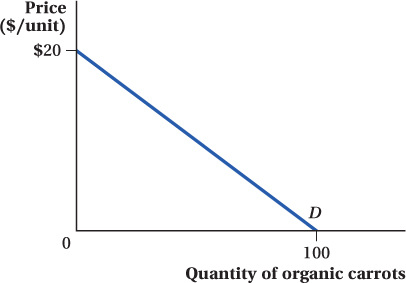
Suppose Pc increases to 15, while I remains at 10. Calculate the quantity demanded of organic carrots. Show the effects of this change on your graph and indicate the choke price. Has there been a change in the demand for organic carrots, or a change in the quantity demanded of organic carrots?
We begin with the demand equation and substitute the given values for PC and I:
QOD = 75 – 5PO + PC + 2I
QOD = 75 – 5PO + 15 + (2 × 10)
This simplifies to
QOD = 110 – 5PO
To find the inverse demand curve, we want to rearrange terms to express P as a function of Q:
5PO = 110 – QOD
PO = 22 – 0.2QOD
We can substitute 10 for the price of organic carrots to find the quantity demanded:
10 = 22 – 0.2QOD
0.2QOD = 12
QOD = 60
We find the choke price by finding the price that would make quantity demanded equal to zero:
PO = 22 – 0.2QOD
PO = 22 – (0.2 × 0) = 22
The demand for organic carrots has changed because the entire curve has shifted to the right.
What happens to the demand for organic carrots when the price of conventional carrots increases? Are organic and conventional carrots complements or substitutes? How do you know?
The demand for organic carrots has increased, shifting the demand curve to the right. This shows that the two goods are substitutes for one another, because an increase in the price of conventional carrots has led to a higher quantity of organic carrots demanded at any given price.
What happens to the demand for organic carrots when the average consumer’s income increases? Are carrots a normal or an inferior good?
There is a positive coefficient (+2) on the variable for income. This means that an increase in income will shift the demand for organic carrots to the right. As a consequence, we know that organic carrots are a normal good.
Out of the following events, which are likely to cause the demand for coffee to increase? Explain your answers.
Since tea and coffee are the classic examples of substitutes, as the price of tea increases, the demand for coffee is likely to increase.
An increase in the price of tea
Since tea and coffee are the classic examples of substitutes, as the price of tea increases, the demand for coffee is likely to increase.
An increase in the price of doughnuts
An increase in the price of doughnuts decreases the quantity demanded of doughnuts. Because doughnuts and coffee are complements, this will likely decrease the demand for coffee.
A decrease in the price of coffee
A decrease in the price of coffee will decrease the quantity demanded of coffee via a movement along the demand curve.
The Surgeon General’s announcement that drinking coffee lowers the risk of heart disease
The Surgeon General’s announcement will likely increase the number of people who are interested in drinking coffee and, thus, increase the demand for coffee.
Heavy rains causing a record-
low coffee harvest in Colombia Heavy rain will decrease the supply of coffee. This can be shown as an inward shift of the supply curve. As a result, the equilibrium price increases and the equilibrium quantity decreases. This adjustment is accomplished via a movement along the demand curve.
How is each of the following events likely to shift the supply curve or the demand curve for fast-
food hamburgers in the United States? Make sure you indicate which curve (curves) is affected and if it shifts out or in. The price of beef triples.
The price of chicken falls by half.
The number of teenagers in the economy falls due to population aging.
53
Mad cow disease, a rare but fatal medical condition caused by eating tainted beef, becomes common in the United States.
The Food and Drug Administration publishes a report stating that a certain weight-
loss diet, which encourages the intake of large amounts of meat, is dangerous to one’s health. An inexpensive new grill for home use that makes delicious hamburgers is heavily advertised on television.
The minimum wage rises.
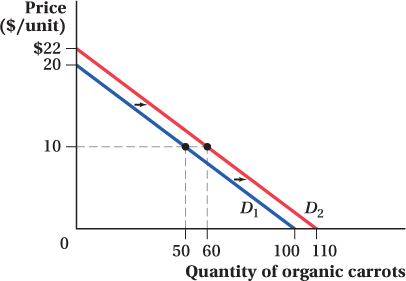
The supply of wheat is given by the following equation:
where
 is the quantity of wheat supplied, in millions of bushels; Pw is the price of wheat per bushel; Pc is the price of corn per bushel; and Pf is the price of tractor fuel per gallon.
Graph the inverse supply curve when corn sells for $4 a bushel and fuel sells for $2 a gallon. What is the supply choke price?
How much wheat will be supplied at a price of $4? $8?
What will happen to the supply of wheat if the price of corn increases to $6 per bushel? Explain intuitively; then graph the new inverse supply carefully and indicate the new choke price.
Suppose instead that the price of corn remains $4, but the price of fuel decreases to $1. What will happen to the supply of wheat as a result? Explain intuitively; then graph the new inverse supply. Be sure to indicate the new choke price.
Collectors of vintage lightning rods formerly had to drift from antique store to antique store, hoping to find a lightning rod for sale. The invention of the Internet reduced the cost of finding lightning rods available for sale.
Draw a diagram showing how the invention and popularization of the Internet have caused the demand curve for lightning rods to shift.
Suppose that the only change in the market for lightning rods is the change you described in (a). How would that change affect the equilibrium price of lightning rods and the equilibrium quantity of lightning rods sold?
In March 2002 the retail price of gasoline was $1.19 per gallon—
exactly the same as it was in August 1990. Yet, total gasoline production and consumption rose from 6.6 million barrels per week in 1990 to 8.7 million barrels per week in 2002. Using the graph below, draw the appropriate shifts in the demand and supply curves to explain these two phenomena. 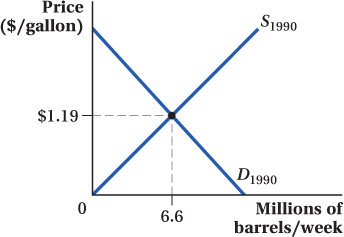
When the demand for toilet paper increases, the equilibrium quantity sold increases. Consumers are buying more, and producers are producing more.
How do producers receive the signal that they need to increase production to meet the new demand?
Based on the facts given above, can you say that an increase in the demand for toilet paper causes an increase in the supply of toilet paper? Carefully explain why or why not.
-
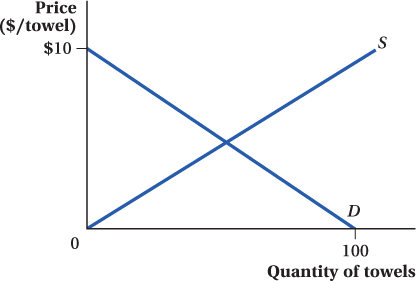
Suppose the demand for towels is given by QD = 100 – 5P, and the supply of towels is given by QS = 10P.
Derive and graph the inverse supply and inverse demand curves.
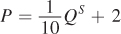
The inverse supply is

whereas the inverse demand is
See graph below.
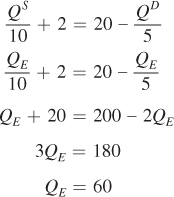
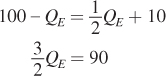
Solve for the equilibrium price and quantity.
Define QE and PE as equilibrium quantity and price, respectively. In equilibrium, price is such that quantity demanded is equal to quantity supplied. Therefore in equilibrium,
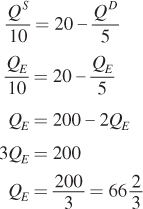
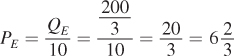
The equilibrium price is then
Suppose that supply changes so that at each price, 20 fewer towels are offered for sale. Derive and graph the new inverse supply curve.
The new supply function is
QS = 10P – 20
Hence, the new inverse supply function is
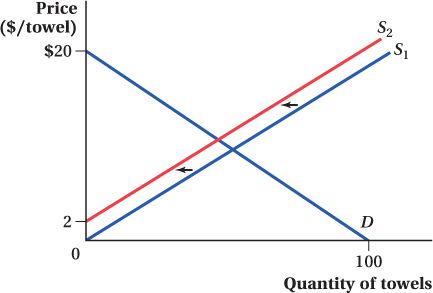
Solve for the new equilibrium price and quantity. How does the decrease in supply affect the equilibrium price and quantity sold?
Solving for the new equilibrium price and quantity, we get
The equilibrium price is now
The decrease in supply has lowered the equilibrium quantity to 60 and raised the equilibrium price to 8.
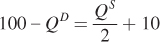
Suppose instead that supply does not change, but demand decreases so that at each price, 25 fewer towels are desired by consumers. Solve for the new equilibrium price, and quantity. How does the decrease in demand affect the equilibrium price and quantity sold? How do those changes compare to your response in (d)?
If the quantity of towels demanded at any given price is 25 less than before, this means that the demand equation becomes QD = 75 – 5P and the inverse demand is P = 15 – 0.2QD.
Therefore, in equilibrium,
SB-
3 The equilibrium price is now
 .
.The decrease in demand has lowered both the equilibrium price and quantity. This is in contrast to the decrease in supply that lowered the equilibrium quantity and raised the equilibrium price.
Your university has an honors program that accepts exactly 40 freshmen each year. Every year before soliciting applications, students are informed of the standards for program participation. The admissions staff observed that whenever the difficulty of the program requirements increased (decreased), they received fewer (more) applicants than in the previous year and have since begun to adjust requirements for each incoming group of students in an attempt to equate the number of applicants with the number of spots in the program. Though the system is not perfect, the administrators are able to estimate their applicant pool relatively accurately.
54
In this situation, what is the “price” that determines how many students will apply to the honors program? Also, assume that the people who run the honors program do not plan to expand or contract it. Depict the demand and supply curves that represent this situation.
How does the way “price” is determined in this situation differ from the way we normally think about the determination of equilibrium price?
-
Consider the market for van Gogh paintings and assume no forgeries are possible.
Is the supply of van Gogh paintings somewhat elastic, somewhat inelastic, perfectly elastic, or perfectly inelastic? Why?
Draw the supply curve for van Gogh paintings.
Suppose there are only 10 van Gogh paintings in the world, and the demand curve is Q = 50 – 0.5P. What is the equilibrium price?
A tragic fire destroys five of the paintings. What is the new equilibrium price?
-
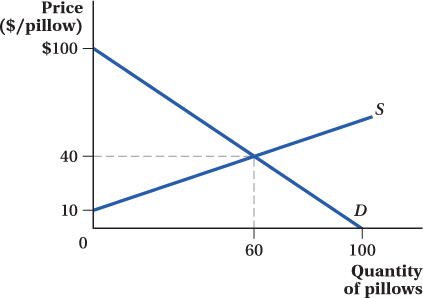
Suppose the demand for down pillows is given by QD = 100 – P, and that the supply of down pillows is given by QS = –20 + 2P.
Solve for the equilibrium price.
In equilibrium, QS = QD so that
QD = 100 – P = –20 + 2P = QS
100 – P = –20 + 2P
PE = 40
The equilibrium price for pillows is 40.
Plug the equilibrium price back into the demand equation and solve for the equilibrium quantity.
The equilibrium quantity is
QE = 100 – PE = 60
Double-
check your work by plugging the equilibrium price back into the supply equation and solving for the equilibrium quantity. Does your answer agree with what you got in (b)? The equilibrium quantity using the supply equation is
QS = –20 + 2PE = 60 = QE
Hence, QS = QD = QE, just like what was obtained in (b).
Solve for the elasticities of demand and supply at the equilibrium point. Which is more elastic, demand or supply?
The elasticity of supply or demand can be calculated using the expression
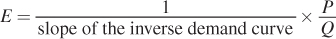
Note that P = 40 and Q = 60 at the equilibrium point. The slope of the demand curve is –1, so that
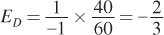
whereas the slope of our supply curve is 0.5, so
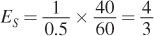
The elasticity of demand lies within the interval –1 < ED < 0. Hence, the demand is inelastic. The coefficient of elasticity of supply indicates that supply is elastic. Out of the two, the supply is more elastic.
Invert the demand and supply functions (in other words, solve each for P) and graph them. Do the equilibrium point and relative elasticities shown in the graph appear to coincide with your answers?
Inverting the demand function, we get
QD = 100 – P
P = 100 – QD
Inverting the supply function yields
QS = –20 + 2P
P = 0.5QS + 10
At the equilibrium, we get
QE = 60
PE = 100 – QE = 40
Therefore, the equilibrium point coincides with our previous answer. Since the equilibrium point is the same and since the slopes of both curves are also unchanged, the elasticities will correspond to the previously derived coefficients in part (d).
-
Determine the effects of the following events on the price and quantity of beer sold. Assume that beer is a normal good.
The price of wine, a substitute for beer, decreases.
The price of pizza, a complement to beer, increases.
The price of barley, an ingredient used to make beer, increases.
Brewers discover they can make more money producing wine than they can producing beer.
Consumers’ incomes increase as the economy emerges from a recession.
-
Suppose that budding economist Buck measures the inverse demand curve for toffee as P = $100 – QD, and the inverse supply curve as P = QS. Buck’s economist friend Penny likes to measure everything in cents. She measures the inverse demand for toffee as P = 10,000 – 100QD, and the inverse supply curve as P = 100QS.
Find the slope of the inverse demand curve, and compute the price elasticity of demand at the market equilibrium using Buck’s measurements.
Find the slope of the inverse demand curve, and compute the price elasticity of demand at the market equilibrium using Penny’s measurements. Is the slope the same as Buck calculated? How about the price elasticity of demand?
Some policy makers have claimed that the U.S. government should purchase illegal drugs, such as cocaine, to increase the price that drug users face and therefore reduce their consumption. Does this idea have any merit? Illustrate this logic in a simple supply and demand framework. How does the elasticity of demand for illegal drugs relate to the efficacy of this policy? Are you more or less willing to favor this policy if you are told demand is inelastic?
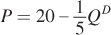
Suppose that a typical consumer has an inverse demand for frog’s legs given by the following:
 . A graph of that inverse demand curve is given below:
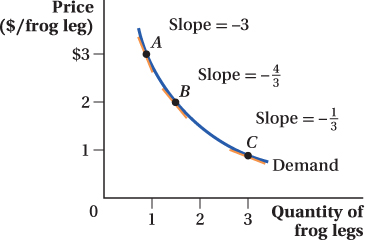
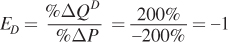
Show that the demand curve is unit elastic.
Consider increasing frog’s legs from 1 to 3; that is, by 200%. On the other hand, the price decreases from $3 to $1; that is, by 200%. Hence, the price elasticity of demand is
The demand curve is unit-
elastic. The cross-
price elasticity of demand measures the percentage change in the quantity of a good demanded when the price of a different good changes by 1%. The income elasticity of demand measures the percentage change in the quantity of a good demanded when the income of buyers changes by 1%. What sign might you expect the cross-
price elasticity to have if the two goods are shampoo and conditioner? Why? 55
What sign might you expect the cross-
price elasticity to have if the two goods are gasoline and ethanol? Why? What sign might you expect the cross-
price elasticity to have if the two goods are coffee and shoes? Why? What sign might you expect the income elasticity to have if the good in question is hot stone massages? Why?
What sign might you expect the income elasticity to have if the good in question is Ramen noodles? Why?
What sign might you expect the income elasticity to have if the good in question is table salt? Why?
Which of the following cases will result in the largest decrease in equilibrium price? The largest change in equilibrium quantity? Verify your answers by drawing graphs.
Demand is highly inelastic; there is a relatively large increase in supply.
Demand is highly elastic; there is a relatively small increase in supply.
Supply is highly inelastic; there is a relatively small decrease in demand.
Supply is highly elastic and demand is very inelastic; there is a relatively large increase in supply.
 Work this problem with calculus