13.4 Long-Run Implications of Fiscal Policy
In 2009 the government of Greece ran into a financial wall. Like most other governments in Europe (and the Canadian government, too), the Greek government was running a large budget deficit, which meant that it needed to keep borrowing more funds, both to cover its expenses and to pay off existing loans as they came due. But governments, like companies or individuals, can only borrow if lenders believe there’s a good chance they are willing or able to repay their debts. By 2009 most investors, having lost confidence in Greece’s financial future, were no longer willing to lend to the Greek government. Those few who were willing to lend demanded very high interest rates to compensate them for the risk of loss.
Figure 13-10 compares interest rates on 10-year bonds issued by the governments of Greece and Germany. At the beginning of 2007, Greece could borrow at almost the same rate as Germany, widely considered a very safe borrower. By the end of 2011, however, Greece was having to pay an interest rate around 10 times the rate Germany paid.
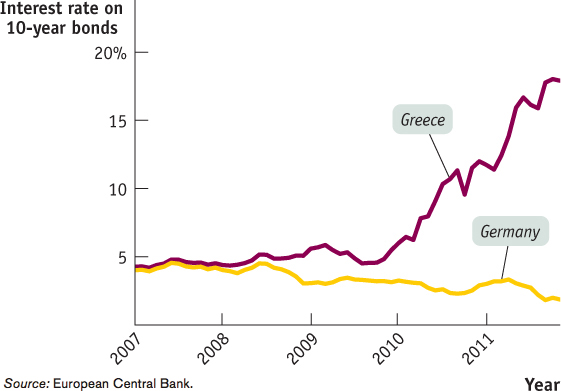
Source: European Central Bank.
Why was Greece having these problems? Largely because investors had become deeply worried about the level of its debt (in part because it became clear that the Greek government had been using creative accounting to hide just how much debt it had already taken on). Government debt is, after all, a promise to make future payments to lenders. By 2009 it seemed likely that the Greek government had already promised more than it could possibly deliver.

The result was that Greece found itself unable to borrow more from private lenders; it received emergency loans from other European nations and the International Monetary Fund, but these loans came with the requirement that the Greek government make severe spending cuts (commonly called austerity measures), which wreaked havoc with its economy, imposed severe economic hardship on Greeks, and led to massive social unrest. The Greek sovereign debt crisis has caused serious concerns about other members of the eurozone, such as Spain, that face similar problems; this may undermine the long-
No discussion of fiscal policy is complete if it doesn’t take into account the long-
Deficits, Surpluses, and Debt
When a family spends more than it earns over the course of a year, it has to raise the extra funds either by selling assets or by borrowing. And if a family borrows year after year, it will eventually end up with a lot of debt.
The same is true for governments. With a few exceptions, governments don’t raise large sums by selling assets such as national parkland. Instead, when a government spends more than the tax revenue it receives—
A fiscal year runs from April 1 to the end of March.
To interpret the numbers that follow, you need to know a slightly peculiar feature of federal government accounting. The Canadian government does not keep its books by calendar year. Instead, budget totals are kept by fiscal years that run from April 1 to March 31. For example, the fiscal year that runs from April 1, 2012 to March 31, 2013 is called “fiscal year 2012–2013.”
DEFICITS VERSUS DEBT
One common mistake—
A deficit is the difference between the amount of money a government spends and the amount it receives in taxes over a given period—
A debt is the sum of money a government owes at a particular point in time. Debt numbers usually come with a specific date, as in “the Canadian federal debt was at $582.2 billion at the end of the 2011–2012 fiscal year.”
Deficits and debt are linked, because government debt grows when governments run deficits. But they aren’t the same thing, and they can even tell different stories. For example, Italy, which found itself in debt trouble in 2011, had a fairly small deficit by historical standards, but it had very high debt, a legacy of past policies.
Public debt is government debt held by individuals and institutions outside the government.
At the end of the fiscal year 2011–2012, the Canadian federal government debt was $582.2 billion—
Problems Posed by Rising Government Debt
There are two reasons to be concerned when a government runs persistent budget deficits. We described one reason in Chapter 10: when the government runs budget deficits while the economy is at full employment, national savings tends to fall and interest rates tend to rise, owing to a leftward shift in the supply of loanable funds curve. In turn, higher interest rates raise the cost of investment spending, which leads to a decrease in investment spending. In other words, when the government runs budget deficits instead of contributing to national savings, it is borrowing funds in the financial markets and competing with firms and households that plan to borrow funds for investment spending. As a result, when the economy is at full employment, government borrowing may increase interest rates, crowd out private investment spending, and reduce the economy’s long-
But there’s a second reason: today’s deficits, by increasing the government’s debt, place financial pressure on future budgets. The impact of current deficits on future budgets is straightforward. Like individuals, governments must pay their bills, including interest payments on their accumulated debt. When a government is deeply in debt, those interest payments can be substantial. In the 2011–2012 fiscal year, the federal government paid $31 billion in interest on its debts, which is equivalent to 1.8% of GDP. The more heavily indebted government of Italy used 4.7% of its GDP in 2011 to service its debt.
Other things equal, a government paying large sums in interest must raise more revenue from taxes or spend less than it would otherwise be able to afford—
Canadians aren’t used to the idea of government default, but such things do happen. In the 1990s Argentina, a relatively high-
THE CANADIAN WAY OF DEBT
How does Canada’s public debt stack up internationally? We could answer that question in dollar terms, but that number would not be very useful for purposes of comparison, because the economies of countries can differ so widely in size. A more informative comparison is the ratio of public debt to GDP (the debt-
The accompanying figure shows the net public debt of a number of rich countries as a percentage of GDP at the end of 2011. Net public debt is government debt minus any assets governments may have—
It may not come as a surprise that Greece heads the list, with the highest debt-
In contrast, Norway has a large negative net public debt. What’s going on in Norway? In a word, oil. Thanks to large offshore deposits in the North Sea, Norway is the world’s third-
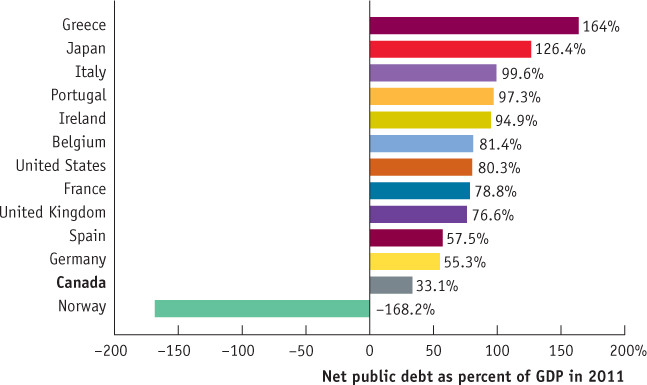
Source: International Monetary Fund.
Default creates havoc in a country’s financial markets and badly shakes public confidence in both the government and the economy. Argentina’s debt default was accompanied by a crisis in the country’s banking system and a very severe recession. And even if a highly indebted government avoids default, a heavy debt burden typically forces it to slash spending or raise taxes, politically unpopular measures that can also damage the economy. In some cases, austerity measures intended to reassure lenders that the government can indeed pay end up depressing the economy so much that lender confidence continues to fall—
Similarly, some European countries saw their credit levels downgraded in 2011 and 2012, owing to worries over excessive government borrowing. Greece and Spain were the most notable examples, but Portugal, Italy, France, and Austria were also members of that unfortunate club. Table 13-2 shows long-
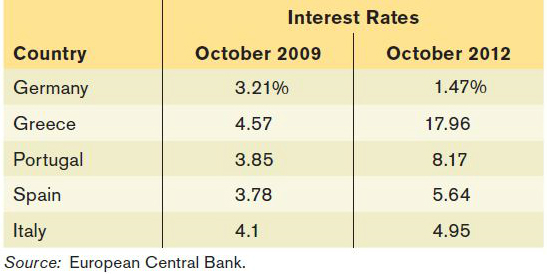
Some may ask why can’t a government that has trouble borrowing just print money to pay its bills? Yes, it can if it has its own currency (which the troubled European nations don’t). But printing money to pay the government’s bills can lead to another problem: inflation. In fact, budget problems are the main cause of very severe inflation, as we’ll see in Chapter 16. The point for now is that governments do not want to find themselves in a position where the choice is between defaulting on their debts and inflating those debts away by printing money.
Concerns about the long-
Deficits and Debt in Practice
Figure 13-11 shows how Canada’s federal government’s budget balance and its debt evolved from the 1970–1971 fiscal year to the 2011–2012 fiscal year. The burgundy curve shows the federal budget balance as a percentage of GDP. A positive number means a budget surplus while a negative number means a deficit. As you can see, the federal government normally ran deficits, except from 1997 to 2008, when it ran surpluses. This seems inconsistent with the advice that governments should offset deficits in bad times with surpluses in good times.
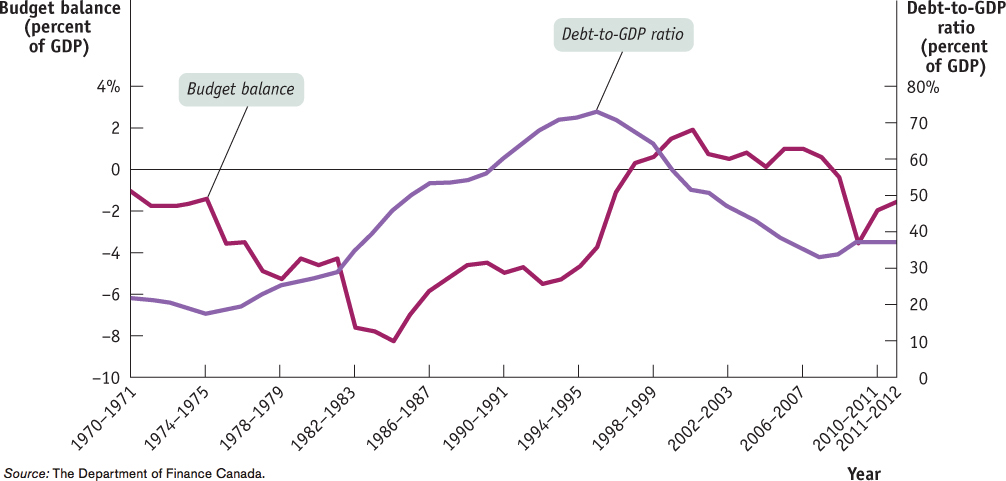
Source: The Department of Finance Canada.
The debt–to-GDP ratio is the government’s debt as a percentage of GDP.
To assess a government’s ability to pay its debt, economists tend to use the debt-to-GDP ratio, the government’s debt as a percentage of GDP. We use this measure, rather than simply looking at the size (or stock) of the debt, because GDP, which measures the size of the economy as a whole, is a good indicator of the potential amount of taxes the government can collect. The purple curve shows the country’s debt-
Alarmed by the rising ratio, Canadians demanded that the federal government take appropriate action. So, when the Liberal Party won the federal election of 1993, Prime Minister Jean Chrétien made the reduction of budget deficits and the national debt one of his top priorities. To do so, government expenditures were cut significantly, particularly by large reductions both in transfer payments to the provinces and in government services. After four years, the federal government finally turned the corner and, in the 1997–1998 fiscal year, it began to run budget surpluses. With these favourable economic conditions, the debt-
True, the financial crisis of 2008–2009 did push the budget back into deficits and caused the debt-
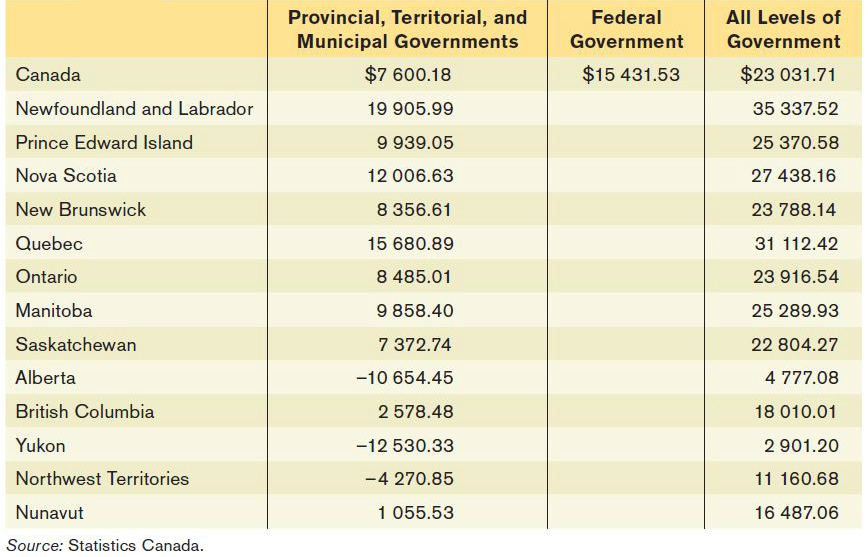
To assess what burden a country’s national debt places on the country, look at the debt-
Table 13-3 shows that in 2007, just before the recession began in 2008, the combined amount of government debt in Canada was about $23 000 per capita, that is, per person. Two thirds of this debt came from the federal government and one third was issued by all the provincial, territorial, and municipal governments combined. At the national level, this debt was about 50% of GDP per capita in 2007. It is interesting to note the great variability in the levels of per capita provincial, territorial, and municipal debt across the nation; this clearly shows that some jurisdictions, especially those in western Canada and the territories, were in better financial shape than others. In fact, based on the strength of revenues from resource exploration and extraction, several jurisdictions, most notably Alberta, Yukon, and Northwest Territories, had a negative level of combined provincial, territorial, and municipal debt, which means these governments actually had more assets than liabilities.
WHAT HAPPENED TO THE DEBT FROM WORLD WAR II?
The Canadian government paid for World War II by borrowing on a huge scale. By the war’s end, the net debt of the federal government was more than 100% of GDP, and many people worried about how it could ever be paid off.
The truth is that it never was paid off. In 1946 net public debt was $13.4 billion; that number dipped slightly in the next few years, as Canada ran post-
But by that time nobody was worried about the fiscal health of the Canadian government because the debt-
Implicit Liabilities
Looking at Figure 13-11, you might be tempted to conclude that until the 2008–2009 financial crisis struck, Canada was in good fiscal shape. The federal government was running budget surpluses and our debt-to-GDP ratio had fallen to a comfortably low level. The ratio did rise slightly in 2008, owing to budget deficit, but was still low compared both to historical experience and to other wealthy countries such as Japan and the United States. Even so, experts on long-run budget issues tend to view Canada’s fiscal position (not to mention that of other countries such as the U.S., Japan, and Italy) with a little alarm. The reason is implicit liabilities. Implicit liabilities are essentially debts that a government must pay at some future date but that are omitted from the usual debt statistics.
Implicit liabilities are spending promises made by governments that are effectively a debt despite the fact that they are not included in the usual debt statistics.
Canada’s largest implicit liabilities come from transfer programs, including the Canada Health Transfer (CHT), the Canada Social Transfer (CST), and benefits for retired and elderly people such as Old Age Security (OAS) and Guaranteed Income Supplement and Allowance (GIS). In each of these cases, the government has promised to provide transfer payments to future as well as current beneficiaries. So, these programs represent a future debt that must be honoured, even though it does not show up in the usual statistics. In the fiscal year 2011–2012 for example, spending on these programs reached $76.73 billion, or 28.3% of total federal spending.
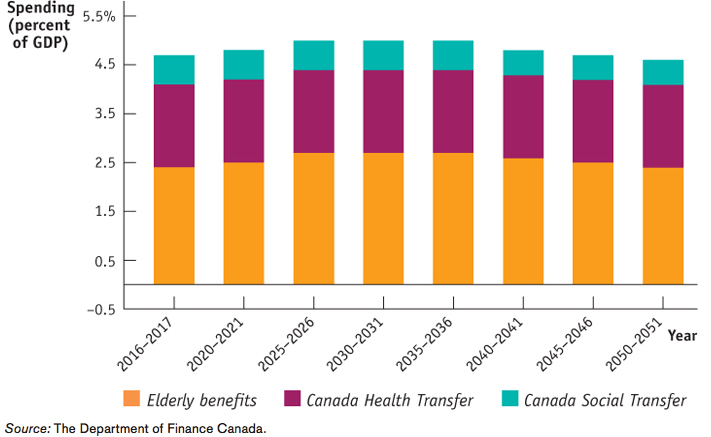
The implicit liabilities created by these transfer programs seem worrisome. Figure 13-12 shows why. From 1966 to 2011 actual spending on OAS, CHT, and CST as percentages of GDP has tended to rise, making such promises harder to keep. Figure 13-12 plots projections from the federal Department of Finance presented in Budget 2012: Economic Action Plan 2010—A Plan for Jobs, Growth and Long-term Prosperity. According to these projections, the cost as a percentage of GDP for these transfer programs will continue to rise over the next few decades, implying more government resources will be allocated to these programs than others.
Source: The Department of Finance Canada.
In the case of Old Age Security, what do the demographics reveal? The money for OAS benefits comes from the taxes paid by people who are working now. So, the ratio of workers to retirees is important when it comes to OAS. From 1946 to 1964, there was a huge surge in the birth rate, called the “baby boom.” At the time of writing, most “boomers” were of working age, so they were paying taxes, not collecting benefits. But as increasing numbers of boomers start to retire they will stop earning employment (taxable) income and start collecting benefits. Also, Canadians are living longer, which means they may have the opportunity to collect OAS benefits for more years than previous generations did. These two factors will have an effect on the ratio of workers to retirees, and subsequently have a major impact on the system’s finances.
One measure that approximates the ratio of workers to retirees is the ratio of people aged 20 to 64 to those aged 65 and over. The Department of Finance projects this ratio will fall from 4.8 in 2011 to only 2.4 in 2050. This means fewer working adults will be available to support retirees, which also increases the burden of the working population. But boomers may not pose a long-run fiscal problem after all. In 2011, the money spent on elderly benefits amounted to 2.2% of GDP. Jean-Claude Ménard, the head actuary at the Department of Finance, has projected that this amount will rise to 2.7% of GDP by 2050, which is a relatively small percentage increase. So although Canada’s population is aging, it seems we can still afford to provide promised social benefits to retirees.
How about the spending on Canada Health Transfer and Canada Social Transfer? CHT is the federal government transfer to the provincial and territorial governments to assist in the delivery and funding of health care. CHT is the largest major transfer to provinces and territories. Currently, the CHT cash transfers are set to grow at 6% annually until the fiscal year of 2016–2017; after that they will be reduced to 3% annual growth or a measure of the nominal GDP known as the “three-year moving average,” whichever is larger. On the other hand, CST is a federal block transfer to the provincial and territorial governments to support post-secondary education, social assistance and social services, early childhood development, and early learning and child care. The CST is growing at 3% annually. As Figure 13-12 shows, the Department of Finance projects that the shares of CHT and CST as percentage of GDP will be relatively stable, at around 2.3% of GDP.
Based on these estimates, it seems that Canada’s implicit liabilities will not pose serious problems for future federal budgets. But the outlook for provincial and territorial budgets is less optimistic. In Canada, provinces and territories, not the federal government, pay for their own health care and education. CHT and CST are just federal transfers that help provinces and territories to fund their programs. Many argue that owing to the planned reductions to CHT funding after 2016–2017, provincial and territorial governments will need to spend more on health care in the future. In fact, according to the Office of the Parliamentary Budget Officer, provincial and territorial health care spending will likely increase from less than 10% of GDP in 2012–2013 to about 14% in 2075–2076. This is a significant percentage increase, and this higher burden on provincial and territorial budgets could easily cause the net debt issued by these governments to rise.
AUSTERITY DILEMMAS
Suppose that a country’s economy hits a rough patch and lenders worry if the government, already deeply indebted, will be able to repay its loans. As a result, lenders cut off further lending. What’s a government to do?
The usual prescription has been fiscal austerity: cut government spending and raise taxes, to both reduce the need to borrow more funds and to demonstrate to lenders the ability and determination to do what’s necessary to honour debts. But besides being painful and politically unpopular, does fiscal austerity really work to extricate a country from a crisis of lender confidence? Both economics and history indicate that the likely answer is no.
Fiscal austerity means contractionary fiscal policy. And we know from our earlier analysis that if an economy is already depressed, contractionary fiscal policy will depress it further. Moreover, the experiences of Argentina and Ireland show that the worsened state of an economy arising from austerity can further undermine the lender confidence that it was supposed to support.
Argentina presents a clear picture of the dynamic. Starting in the 1990s, Argentina was a favourite of foreign lenders and borrowed freely from abroad. But its debts accumulated, and by the late 2000s when the economy hit a downturn, lenders began to get worried. From 1997 to 2001, Argentina tried to reassure lenders that it was credit-worthy by repeatedly raising taxes and cutting government spending. But each round of austerity so weakened the economy that the government was unable to balance its budget. Finally, facing massive popular protests, the government collapsed and defaulted on its debts.
Since 2009, Ireland has gone through a similar experience, although the origins of its troubles were different. Until 2008, Ireland’s government ran a more or less balanced budget. But during the 2000s, the Irish economy had a massive real estate bubble, fuelled by excessive bank lending to real estate developers. When the bubble burst, Irish banks were left with massive losses. In order to prop them up, the Irish government guaranteed the banks’ losses, making Irish taxpayers responsible for paying off the banks’ debts. But, as it turns out, these debts were so large that the government’s own solvency came into question, and the interest rate at which it had to borrow rose abruptly. This result can be seen in Figure 13-13, which shows how the interest rate spread between Irish government bonds and German government bonds (which are considered very safe) jumped in late 2008 and early 2009.
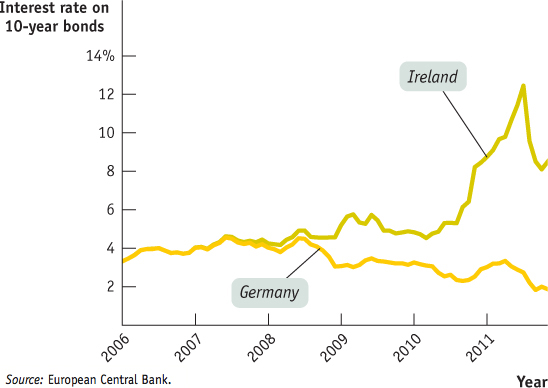
Source: European Central Bank.
In an attempt to regain lender confidence, Ireland imposed severe austerity, even though the economy had already fallen into recession. For example, the government adopted a policy of reducing its workforce by 25000; calculated as a percentage of the population, this was equivalent to a loss of 250 000 jobs in Canada.
By mid-2010, the Irish austerity policy appeared to be working, as rates on Irish bonds stabilized and even fell a bit from 2009 to 2010. But by 2011, it all fell apart as the size of the banks’ losses continued to mushroom and it became clear that the austerity policies were pushing the economy deeper into a recession. By late 2010, Irish GDP was 12% lower than it had been at the end of 2007. The weaknesses of the Irish economy were depressing tax revenues, undoing much of the direct effect of austerity. Simultaneously, the decline in GDP had contributed to a surge in the debt-to-GDP ratio. At the time of writing, Irish officials were still hoping to regain lender confidence through even harsher austerity measures, although prospects did not look encouraging.
So why do lenders advocate, and indebted countries adopt, such self-defeating austerity measures? Because they make the mistake of thinking that an economy is like a household: if the family would just cut back on their spending, so the thinking goes, then they could pay their credit card bills. But as we know, an economy is not like a family; instead, one person’s spending is another person’s income. So austerity measures that reduce spending end up reducing income and making it even less likely that a country can repay its debts.

Quick Review
Persistent budget deficits lead to increases in public debt.
Rising public debt can lead to government default. In less extreme cases, it can crowd out investment spending, reducing long-run growth. This suggests that budget deficits in bad fiscal years should be offset with budget surpluses in good fiscal years.
A widely used indicator of fiscal health is the debt-to-GDP ratio. A country with rising GDP can have a stable or falling debt-to-GDP ratio even if it runs budget deficits if GDP is growing faster than the debt.
In addition to their official public debt, modern governments have implicit liabilities. The Canadian government has large implicit liabilities in the form of benefits such as Old Age Security, Guaranteed Income Supplement, Canada Health Transfer, and Canada Social Transfer.
Check Your Understanding 13-4
CHECK YOUR UNDERSTANDING 13-4
Explain how each of the following events would affect the public debt or implicit liabilities of the Canadian government, other things equal. Would the public debt or implicit liabilities be greater or smaller?
A higher growth rate of real GDP
Retirees live longer
A decrease in tax revenue
Government borrowing to pay interest on its current public debt
A higher growth rate of real GDP implies that tax revenue will increase. If government spending remains constant and the government runs a budget surplus, the size of the public debt will be less than it would otherwise have been.
If retirees live longer, the average age of the population increases. As a result, the implicit liabilities of the government increase because spending on programs for older Canadians, such as health care, Old Age Security, and Guaranteed Income Supplement and Allowance, will rise.
A decrease in tax revenue without offsetting reductions in government spending will cause the public debt to increase.
Public debt will increase as a result of government borrowing to pay interest on its current public debt.
Suppose the economy is in a slump and the current public debt is quite large. Explain the trade-off of short-run versus long-run objectives that policy-makers face when deciding whether or not to engage in deficit spending.
In order to stimulate the economy in the short run, the government can use fiscal policy to increase real GDP. This entails borrowing, increasing the size of the public debt further and leading to undesirable consequences: in extreme cases, governments can be forced to default on their debts. Even in less extreme cases, a large public debt is undesirable because government borrowing crowds out borrowing for private investment spending. This reduces the amount of investment spending, reducing the long-run growth of the economy.
Explain how a policy of fiscal austerity can make it more likely that a government is unable to pay its debts.
Fiscal austerity is the same as a contractionary fiscal policy. It reduces government spending, which in turn reduces income and reduces tax revenue. With less tax revenue, the government is less able to pay its debts. Also, a failing economy causes lenders to have less confidence that a government is able to pay its debts and leads them to raise interest rates on the debt. Higher interest rates on the debt make it even less likely the government can repay.
KIP Goes to School: Action Plan Spending on Knowledge Infrastructure

If you were on a Canadian post-secondary campus in 2009 or 2010, there’s a chance you may have seen a construction site there with an Economic Action Plan sign. The EAP included the Knowledge Infrastructure Program (KIP), a $2billion initiative providing funds to universities and colleges to build, repair, and maintain teaching facilities such as lecture halls and laboratories. More than 520 projects at colleges and universities across Canada received funding under this program.
The construction service company EllisDon was awarded several KIP projects, including George Brown College Waterfront Health Sciences Campus in Toronto (pictured here); the Schulich School of Engineering in Calgary; and the Richard Ivey School of Business in London, Ontario. The Canadian authors of this book also indirectly benefitted from this spending as their university (the University of Toronto, Scarborough Campus) was a recipient of KIP funds to build new teaching facilities that would allow students to learn in a better environment.
This spending on building infrastructure has both short-term and long-term benefits to the economy. In the short run, it helps to create jobs. In the long run, better and improved infrastructure should raise the productivity of Canadian workers and the competitiveness of Canadian business in the world economy; and this will translate into long-term sustainable economic growth.
How effective was this spending? KIP was just one part of the “Building Infrastructure to Create Jobs” element of the EAP, which altogether represented $12 billion in spending (23% of the total stimulus package in 2009 and 2010) on better transportation networks, cleaner drinking water systems, improving infrastructure at universities and colleges, and so on. According to the Government of Canada, by December 2010 about 82 000 jobs had been created or maintained under the “Building Infrastructure to Create Jobs” element (about 37% of all the jobs that had been created or maintained as a result of the EAP); and the multiplier associated with this spending was around 1.6, the highest among different elements of the EAP. EllisDon and other companies in the construction business, their employees, and suppliers were clearly getting some benefit from the EAP.
QUESTIONS FOR THOUGHT
Some opponents of fiscal expansion have accused it of consisting of make-work projects of little social value. What does the KIP story say about this view?
Some opponents of fiscal expansion have accused it of consisting of make-work projects of little social value. What does the KIP story say about this view?
Other than construction firms, what other businesses could benefit from the building of infrastructure?
Other than construction firms, what other businesses could benefit from the building of infrastructure?