8.1 The Unemployment Rate
Britain had an unemployment rate of 7.7 percent in early 2011, up from just 5.7 percent in 2008. That was bad. But the Canadian unemployment rate was slightly worse. Figure 8-1 shows the Canadian unemployment rate annually from 1946 to 2011; as you can see, unemployment soared during the 2008–2009 recession and had fallen only modestly by 2011. What did the rise in the unemployment rate mean, and why was it such a big factor in people’s lives? To understand why policy-
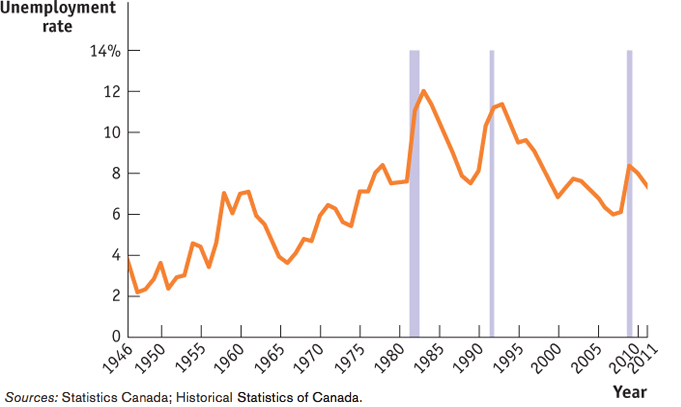
Sources: Statistics Canada; Historical Statistics of Canada.
Defining and Measuring Unemployment
Employment is the total number of people in the economy (aged 15 and older) currently employed, in either a full-
It’s easy to define employment: you’re employed if and only if you have a paid job. Employment is the total number of people aged 15 and older currently employed, either full time or part time.
Unemployment, however, is a more subtle concept. Just because a person isn’t working doesn’t mean that we consider that person unemployed. For example, as of May 2012, there were just more than 5 million retired workers in Canada receiving Old Age Security benefits. Most of them were probably happy that they were no longer working, so we wouldn’t consider someone who has settled into a comfortable, well-
By one criterion, Statistics Canada, the federal agency tasked with collecting data on unemployment, considers the unemployed to be those who are “… without work, … looking for work, and … available for work.” Retired people don’t count because they aren’t looking for jobs; the disabled don’t count because they aren’t available for work. More specifically, an individual aged 15 or older is considered to be unemployed if he or she
does not currently have a paid job (i.e., is not employed);
is available for work; and
has been actively looking for a job during the past four weeks.
Individuals on temporary layoffs and those waiting for a new job to start in the next four weeks or less are considered unemployed if they satisfy conditions 1 and 2. Individuals on either maternity leave or paternity leave are not considered to be unemployed in the official labour force statistics. But, if certain conditions are met, these individuals may qualify for employment insurance (EI) benefit payments similar to those received by some unemployed workers.
Unemployment is the number of available people (aged 15 and older) who are actively looking for paid work but aren’t currently employed.
So unemployment is defined as the total number of available people who aged 15 and older are actively looking for work but aren’t currently employed. A country’s labour force is the sum of employment and unemployment—
The labour force is equal to the sum of the total number of employed people (employment) and the total number of unemployed people (unemployment)—aged 15 or older in all cases.
The labour force participation rate is the percentage of the population aged 15 or older that is in the labour force.

The unemployment rate is the percentage of the labour force that is unemployed.
The unemployment rate, defined as the percentage of the total number of people in the labour force who are unemployed, is calculated as follows:

To estimate the numbers that go into calculating the unemployment rate, Statistics Canada carries out a monthly survey called the Labour Force Survey, which involves interviewing a random sample of 56 000 households across Canada. People are asked whether they are currently employed. If they are not employed, they are asked whether they have been looking for a job during the past four weeks. The results are then scaled up, using estimates of the total population, to estimate the total number of employed and unemployed Canadians.
The Significance of the Unemployment Rate
In general, the unemployment rate is a good indicator of how easy or difficult it is to find a job given the current state of the economy. When the unemployment rate is low, nearly everyone who wants a job can find one. In 2007, when the unemployment rate averaged 6%, jobs were so abundant that employers spoke of a “mirror test” for getting a job: if you were breathing (therefore your breath would fog a mirror), you could find work. By contrast, in 2011, with the unemployment rate at 7.5%, it was harder to find work. In fact, there were almost six times as many Canadians seeking work as there were job openings.
EMPLOYMENT RATE AND UNEMPLOYMENT RATE
Sometimes you may come across the term “employment rate.” What is the employment rate? According to Statistics Canada is defined as the ratio of the number of employed workers to the adult population (people who are aged 15 or above). This ratio is usually expressed as a percentage. So:

Suppose you know that the unemployment rate is 5%. Does that mean that the employment rate is 100% – 5% = 95%? No, probably not. Why? It is because there are some adults who technically do not fall into either category. That is why the employment rate and the unemployment do not add up to 1, or 100%.
Although the unemployment rate is a good indicator of current labour market conditions, it’s not a literal measure of the percentage of people who want a job but can’t find one. That’s because in some ways the unemployment rate exaggerates the difficulty people have in finding jobs. But in other ways, the opposite is true—
How the Unemployment Rate Can Overstate the True Level of Unemployment If you are searching for work, it’s normal to take at least a few weeks to find a suitable job. Yet a worker who is quite confident of finding a job, but has not yet accepted a position, is counted as unemployed. As a consequence, the unemployment rate never falls to zero, even in boom times when jobs are plentiful. Even in the buoyant labour market of 2007, when it was easy to find work, the unemployment rate was still 6%. Later in this chapter, we’ll discuss in greater depth the reasons that measured unemployment persists even when jobs are abundant.
How the Unemployment Rate Can Understate the True Level of Unemployment Frequently, people who would like to work but aren’t working still don’t get counted as unemployed. In particular, an individual who has given up looking for a job for the time being because there are no jobs available—
Discouraged workers are non-
Discouraged workers are not working and have sought employment within the past 12 months; however, they are not currently seeking work because they feel they have little hope of getting a job in the current job market.
Marginally attached workers would like to be employed and have looked for a job in the recent past (more than four weeks ago) but are not currently looking for work as they wait for employment.
Marginally attached workers are not currently working and have stopped seeking employment, too; however, they have stopped looking because they are waiting for employment to begin. For example, they may be waiting for recall after a layoff, for replies from potential employers, or for a new job to start in the next five or more weeks.
Underemployment occurs when workers have jobs that, in certain ways, fall short of what they want.
Underemployed workers do work, but not in the desired capacity. Visibly underemployed workers have jobs in which they work fewers hours than they would like to do. They may have part-
Visible underemployment is the number of people who involuntarily work part time because they cannot find full-
Invisible underemployment is the number of people who have jobs that do not fully use their skills or that have one or more substandard job characteristics, such as low pay.
Statistics Canada does include these three categories of frustrated workers in other “measures of labour underutilization.” Figure 8-2 shows what happens to the unemployment rate when these categories are included. The broadest measure of unemployment and underemployment, known as R8, is the sum of these three measures plus the unemployed. It is substantially higher than the rate usually quoted in the media. But R8 and the unemployment rate move very much in parallel, so changes in the unemployment rate remain a good guide to what is happening in the overall labour market, including frustrated workers.
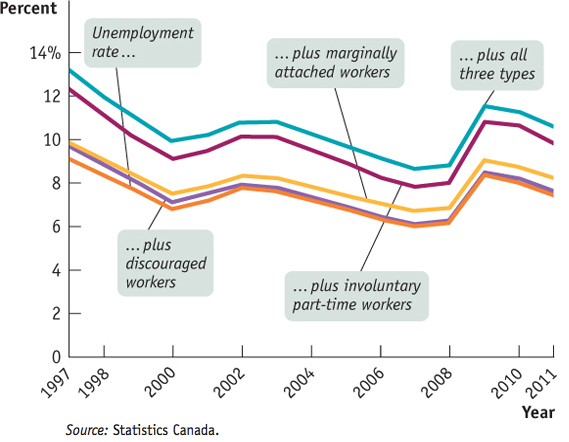
Source: Statistics Canada.
Finally, it’s important to realize that the unemployment rate varies greatly by region and among demographic groups. Other things being equal, jobs are generally easier to find for more experienced workers and for workers during their “prime” working years, from ages 25 to 54. For younger workers, as well as workers nearing retirement age, jobs are typically harder to find.
Similarly, at any moment in time, jobs can be easier or harder to find in different regions of the country, regardless of which demographic group is being considered. Just as there is not really one single labour market for all demographic groups nationally, neither is there just one single labour market for all regions. Different regions may well have macroeconomic conditions and trends that differ from those of the nation as a whole. The job market in resource-
Figure 8-3 shows the unemployment rates for different groups in October 2007, when the overall unemployment rate (5.3%) was low by recent historical standards. As you can see, at this time, the unemployment rate for youth (ages 15–24) was double the national average; the unemployment rate for youth with university degrees was two-
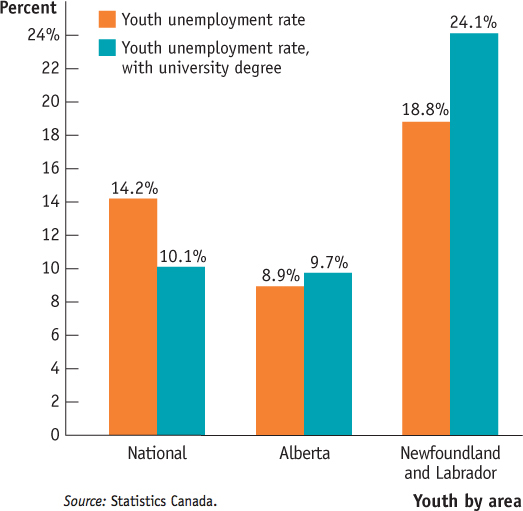
Source: Statistics Canada.
So even at a time when the overall unemployment rate was relatively low, jobs were hard to find for some groups.
So you should interpret the unemployment rate as an indicator of overall labour market conditions, not as an exact, literal measure of the percentage of people unable to find jobs. The unemployment rate is, however, a very good indicator: its ups and downs closely reflect economic changes that have a significant impact on people’s lives. Let’s turn now to the causes of these fluctuations.
Growth and Unemployment
Compared to Figure 8-1, Figure 8-4 shows the Canadian unemployment rate over a somewhat shorter period, the years from 1976 to 2012. The shaded bars represent periods of recession. As you can see, during every recession, without exception, the unemployment rate rose. The severe recession of 2008–2009, like the earlier two recessions, led to a significant rise in unemployment.
Correspondingly, during periods of economic expansion the unemployment rate usually falls. The long economic expansion of the 1990s eventually brought the unemployment rate down to 6.3%, and the expansion of the mid-2000s brought the rate down to 5.3%. However, it’s important to recognize that economic expansions aren’t always periods of falling unemployment. Look at the periods immediately following the recessions of 1990–1991 in Figure 8-4. The unemployment rate continued to rise for more than a year after the recession was officially over. The explanation is that although the economy was growing, it was not growing fast enough to reduce the unemployment rate.
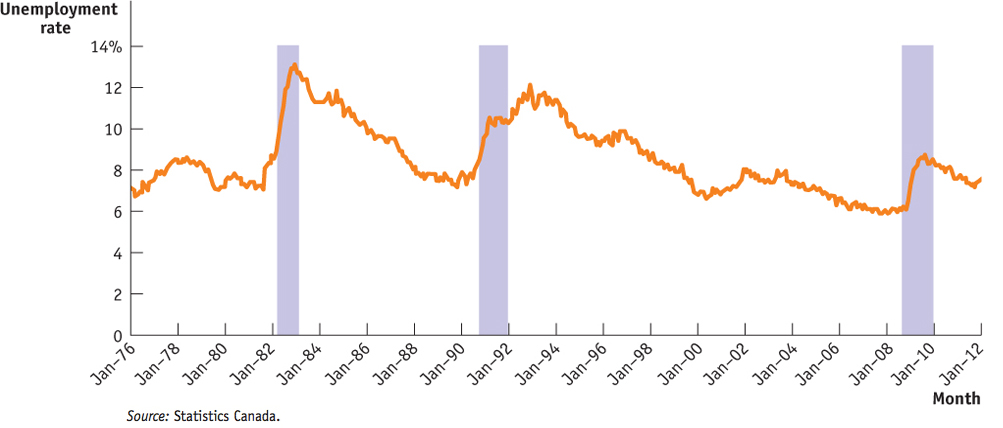
Source: Statistics Canada.
Figure 8-5 is a scatter diagram showing Canadian data for the period from 1946 to 2010. The horizontal axis measures the annual rate of growth in real GDP—the percent by which each year’s real GDP changed compared to the previous year’s real GDP. (Notice that there were four years in which growth was negative—that is, real GDP shrank.) The vertical axis measures the change in the unemployment rate over the previous year in percentage points. Each dot represents the observed growth rate of real GDP and change in the unemployment rate for a given year. For example, in 2000 the average unemployment rate fell to 6.8% from 7.6% in 1999; this is shown as a value of –0.8 along the vertical axis for the year 2000. Over the same period, real GDP grew by 5.2%; this is the value shown along the horizontal axis for the year 2000.
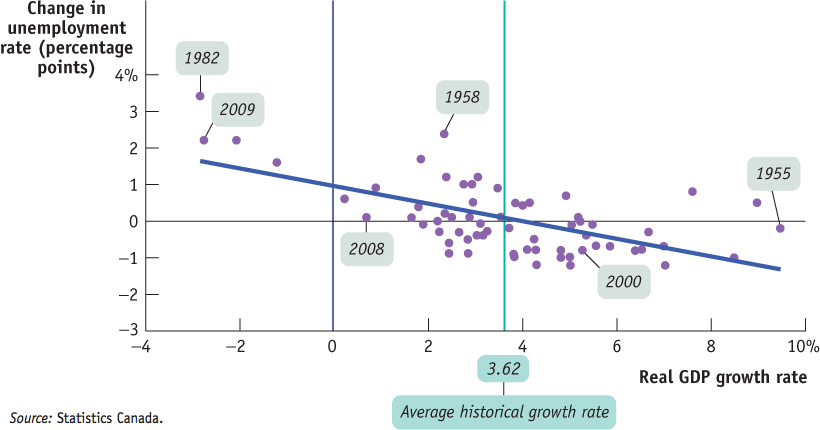
Source: Statistics Canada.
The downward trend of the scatter diagram in Figure 8-5, as indicated by the blue “line of best fit,” shows that there is a generally strong negative relationship between growth in the economy and the rate of unemployment. Years of high growth in real GDP were usually years in which the unemployment rate fell, and years of low or negative growth in real GDP were years in which the unemployment rate usually rose.
The green vertical line in Figure 8-5 at the value of 3.62% indicates the average growth rate of real GDP over the period from 1946 to 2010. Points lying to the right of the vertical line are years of above-average growth. In these years, the value on the vertical axis is usually negative, meaning that the unemployment rate fell. That is, years of above-average growth were usually years in which the unemployment rate was falling. Conversely, points lying to the left of the green vertical line were years of below-average growth. In these years, the value on the vertical axis is usually positive, meaning that the unemployment rate rose. That is, years of below-average growth were usually years in which the unemployment rate was rising.
A period in which real GDP is growing, perhaps at a below-average rate, and unemployment is rising (or at least not falling) is called a jobless recovery or a “growth recession.” Since 1990 there have been two recessions in Canada. The one from 1990 to 1991 was followed by a jobless recovery, while the one from 2008 to 2009 was not. The U.S. has had three recessions since 1990, all of which were followed by jobless recoveries. But true recessions, periods when real GDP falls, are especially painful for workers. As illustrated by the points to the left of the purple vertical line in Figure 8-5 (representing years in which the real GDP growth rate is negative), falling real GDP is always associated with a rising rate of unemployment, causing a great deal of hardship to families. The job loss that recessions create lowers the income and standard of living of many families, which can lead to other significant financial, physical, and emotional troubles for members of society.
A jobless recovery is a period in which the real GDP growth rate is positive but the unemployment rate is still rising (or at least not falling).
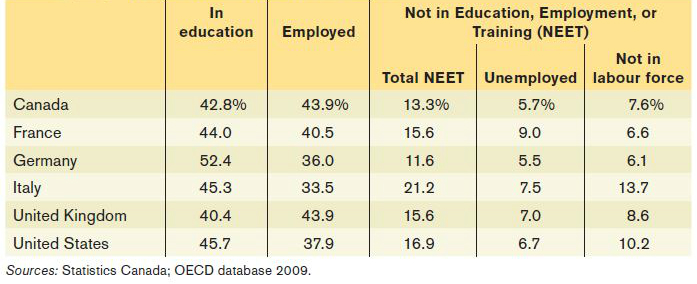
WE DON’T WANT OUR YOUTH TO BE NEET!
According to Statistics Canada, in 2011 about 904 000 (or 13.3%) of the 6.8 million Canadians aged 15 to 29 were Neither Enrolled in school, nor Employed, nor in Training. People in this group are referred to as “NEET.” This concept is meant to measure the percentage of youth who are at risk of becoming discouraged and disengaged, perhaps leading to reduced educational attainment, lack of satisfactory employment opportunities, and other related social problems as a consequence.
Some have argued that the civil unrest and regime changes that occurred in 2010 to 2012 in Tunisia, Egypt, Libya, Yemen, and other countries were fuelled, in part, by limited economic opportunities for the youth of these nations. So, in theory, a high or sharply growing NEET rate could indicate that the future holds the risk of significant economic and political hardship. But not necessarily: the rate may be high because of young people who choose to travel, to engage in leisure activities, to take parental leave, or to do unpaid volunteer work, instead of doing paid work. Some countries may have a high NEET rate for non-economic reasons, such as compulsory military service.
Even though NEET rates may not be absolutely reliable predictors, it is still useful to compare them, either for one country over several years or for several countries during the same year. As Table 8.1 shows, in 2009 Canada had one of the lowest NEET rates in the G7. Furthermore, Canada’s NEET percentage has been very stable from 2001 to 2011, and rose only two percentage points as a result of the 2008–2009 recession.1 Canada’s youth fared better in the recession than their peers in other G7 countries, who saw a substantially greater increase. So we can probably look forward to periods of civil stability.
However, according to the Organisation for Economic Co-operation and Development (OECD), young people, including Canadian youth, are among the demographic groups most at risk of long-term unemployment, which is a concern. Long-term unemployment can harm both the economy of the country and the unemployed workers themselves. Workers often find long-term unemployment (especially when it lasts six months or longer) to be very demoralizing. During these periods, workers may become disheartened by constant rejection and/or they may lose their job market skills. As a result, when the economy does recover and jobs are available, these workers may either be too discouraged to enter the job market or lack the skills to do so. Their absence from the workforce leads to higher structural unemployment, which increases the long-run unemployment rate. Financially, the loss of employment opportunities and skills erosion can put some people on an entirely different employment and career path that may lead to significantly reduced lifetime earnings and standard of living. Psychologically, some people may never quite recover from the experience.

Quick Review
The labour force, equal to employment plus unemployment, does not include discouraged and marginally attached workers. Nor do labour statistics contain data on underemployment. The labour force participation rate is the percentage of the population age 15 and over in the labour force.
The unemployment rate is an indicator of the state of the labour market, not an exact measure of the percentage of workers who can’t find jobs. It can overstate the true level of unemployment because workers often spend time searching for a job even when jobs are plentiful. But it can also understate the true level of unemployment because it excludes discouraged workers, marginally attached workers, and underemployed workers.
There is a strong negative relationship between growth in real GDP and changes in the unemployment rate. When growth is above average, the unemployment rate generally falls. When growth is below average, the unemployment rate generally rises—a period called a jobless recovery that typically follows a deep recession.
Check Your Understanding 8-1
CHECK YOUR UNDERSTANDING 8-1
Suppose that the advent of employment websites enables jobseekers to find suitable jobs more quickly. What effect will this have on the unemployment rate over time? Also suppose that these websites encourage jobseekers who had given up their searches to begin looking again. What effect will this have on the unemployment rate?
The advent of websites that enable job-seekers to find jobs more quickly will reduce the unemployment rate over time. However, websites that induce discouraged workers to begin actively looking for work again will lead to an increase in the unemployment rate over time.
In which of the following cases is a worker counted as unemployed? Explain.
Rosa, an older worker who has been laid off and who gave up looking for work months ago
Anthony, a schoolteacher who is not working during his three-month summer break
Grace, an investment banker who has been laid off and is currently searching for another position
Émile, a classically trained musician who can only find work playing for local parties
Natasha, a graduate student who went back to school because jobs were scarce
Rosa is not counted as unemployed because she is not actively looking for work, but she is counted in broader measures of labour underutilization as a discouraged worker.
Anthony is not counted as unemployed; he is considered employed because he has a job.
Grace is unemployed; she is not working and is actively looking for work.
Sergio is not unemployed, but underemployed; he is working part time for economic reasons. He is counted in broader measures of labour underutilization.
Natasha is not unemployed, but marginally attached. She is counted in broader measures of labour underutilization.
Which of the following are consistent with the observed relationship between growth in real GDP and changes in the unemployment rate? Which are not?
A rise in the unemployment rate accompanies a fall in real GDP.
An exceptionally strong business recovery is associated with a greater percentage of the labour force being employed.
Negative real GDP growth is associated with a fall in the unemployment rate.
Both parts a and b are consistent with the relationship, illustrated in Figure 8-5, between above-average or below-average growth in real GDP and changes in the unemployment rate: during years of above-average growth, the unemployment rate falls, and during years of below-average growth, the unemployment rate rises. However, part c is not consistent: it implies that a recession is associated with a fall in the unemployment rate, which is incorrect.