Chapter 7 Introduction
Hypothesis Testing with z Tests
Raw Scores, z Scores, and Percentages
The z Table and Distributions of Means
The Three Assumptions for Conducting Analyses
The Six Steps of Hypothesis Testing
BEFORE YOU GO ON
You should understand how to calculate a z statistic for a distribution of scores and for a distribution of means (Chapter 6).
You should understand that the z distribution allows us to determine the percentage of scores (or means) that fall below a particular z statistic (Chapter 6).
Page 158
When statistician R. A. Fisher offered a cup of tea to Dr. B. Muriel Bristol, the doctor politely declined, but for a strange reason. She preferred the taste of tea when the milk had been poured into the cup first.

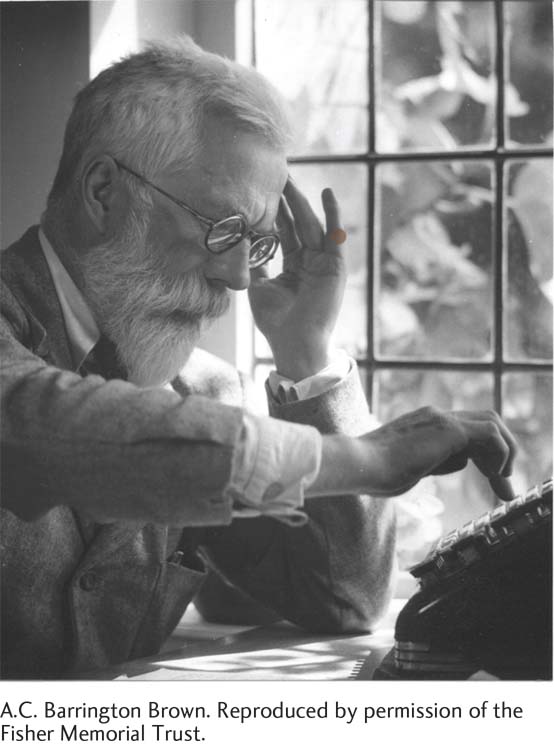
Experimental Design R. A. Fisher was inspired by the “lady drinking tea” who claimed that she could distinguish the taste of a cup of tea that had been poured tea first versus milk first. In his book, The Design of Experiments, he demonstrated how statistics become meaningful within the context of an experimental design.
A.C. Barrington Brown. Reproduced by permission of the Fisher Memorial Trust.
“Nonsense. Surely it makes no difference,” Fisher replied.
William Roach (who had witnessed the exchange between his two colleagues and would later marry Dr. Bristol) suggested, “Let’s test her.” Roach poured cups of tea, some with tea first and others with milk first. But Fisher’s mind was awhirl with statistical concerns about how many cups should be used, their order of presentation, and how to control chance variations in temperature or sweetness. The case of the doctor drinking tea connected probability to experimental design and became one chapter’s opening story in Fisher’s classic textbook, The Design of Experiments (Fisher, 1935/1971).
With only two choices, Dr. Bristol had a 50% chance of getting it right—that is, of selecting a beverage-first cup of tea. But how often would she need to be above the 50% accuracy level, the expected rate of success for a chance hit, for us to believe in her tea-tasting abilities? Obviously, 100% accuracy would be convincing, but other factors (such as the temperature of the tea) shouldn’t play a role in the test. Would 55% convince us? 70%? 95%? William Roach reportedly said, “Miss Bristol divined correctly more than enough of those cups into which tea had been poured first to prove her case” (Box, 1978, p. 134). (Her success in divining tea-first cups of tea turned out to be somewhere above the 50% chance rate.) But no one specified a numerical hypothesis about what “more than enough” actually meant. Regardless, William Roach was in love, so he might have been biased. The important point here is that Fisher’s grand insight from this ordinary event was that probability could be used to test a hypothesis.
We begin our own adventures into the liberating power of hypothesis testing with the simplest hypothesis test, the z test. We learn how the z distribution and the z test make fair comparisons possible through standardization. Specifically, we learn:
-
How to implement the basic steps of hypothesis testing.
How to conduct a z test to compare a single sample to a known population.
