Genes, Environment, and the Development of Intelligence
No issue in psychology has produced more acrimonious debate than the issue of how heredity and environment influence intelligence. Even people who recognize that intelligence, like all human qualities, is constructed through the continuous interaction of genes and environment often forget this fact and take extreme positions that are based more on emotions and ideology than on logic and evidence.
A useful starting point for thinking about genetic and environmental influences on intelligence is Bronfenbrenner’s (1993) bioecological model of development (detailed in Chapter 9). This model envisions children’s lives as embedded within a series of increasingly encompassing environments. The child, with a unique set of qualities including his or her genetic endowment and personal experiences, is at the center. Surrounding the child is the immediate environment, especially the people and institutions with which the child interacts directly: family, school, classmates, teachers, neighbors, and so on. Surrounding the immediate environment are more distant, and less tangible, forces that also influence development: cultural attitudes, the social and economic system, mass media, the government, and so on. We now examine how qualities of the child, the immediate environment, and the broader society contribute to the development of intelligence.

309
Qualities of the Child
Children contribute greatly to their own intellectual development, through their genetic endowment, through the reactions they elicit from other people, and through their choice of environments.
Genetic Contributions to Intelligence
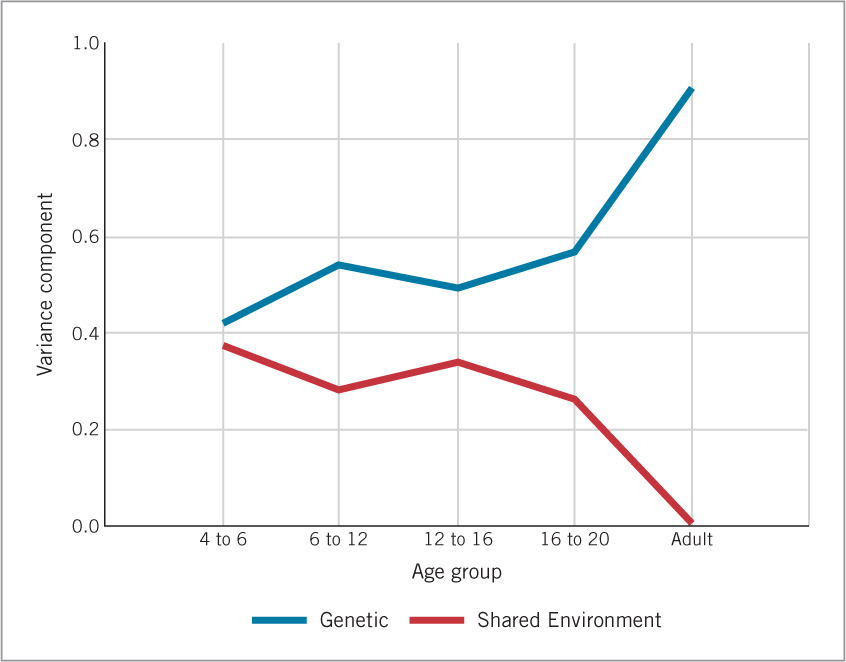
As noted in Chapter 3, the genome has a substantial influence on intelligence. This genetic influence varies greatly with age (Figure 8.5): it is moderate in early childhood and becomes large by adolescence and adulthood (Bouchard, 2004; Plomin et al., 2008). Reflecting the same trend, the IQ scores of adopted children and those of their biological parents become increasingly correlated as the children develop, but the scores of adopted children and their adoptive parents become less correlated over the course of development (Plomin et al., 1997).
One reason for this increasing genetic influence is that some genetic processes do not exert their effects until late childhood or adolescence. For example, some connections linking areas in the brain that are distant from each other are not formed until adolescence, and the extent of such connections reflects genetic influences (Thatcher, 1992). Another reason is that children’s increasing independence with age allows them greater freedom to choose environments that are compatible with their own genetically based preferences but not necessarily with those of the parents who are raising them (McAdams & Olson, 2010).
Advances in genetics have inspired research aimed at identifying a small set of genes that explain individual differences in intelligence. These efforts have led to identification of almost 300 genes that are associated with mental retardation (Inlow & Restifo, 2004) but none that are consistently related to normal variation in intelligence (Butcher et al., 2008; Chabris et al., 2012). The most likely explanation is that the genetic contribution to intelligence reflects small contributions from each of a very large number of genes, as well as complex interactions among them (Nisbett et al., 2012).
Genotype–Environment Interactions

As noted in Chapter 3, the environments children encounter are influenced by their genotype. Sandra Scarr (1992) proposed that gene–environment relations involve three types of processes: passive, evocative, and active.
310
 Passive effects of the genotype arise when children are raised by their biological parents. These effects occur not because of anything the children do but because of the overlap between their parents’ genes and their own. Thus, children whose genotypes predispose them to enjoy reading are likely to be raised in homes with plentiful access to reading matter, because their parents also like to read. The passive effects of the genotype help explain why correlations between biological parents’ and their children’s IQ scores are higher when the children live with their biological parents than when they live with adoptive parents.
-
Evocative effects of the genotype emerge through children’s eliciting or influencing other people’s behavior. For example, even if a child’s parents are not avid readers, they will read more bedtime stories to a child who is interested in the stories than to one who is uninterested.
-
Active effects of the genotype involve children’s choosing environments that they enjoy. A high school student who likes reading will borrow books from the library and obtain books in other ways, regardless of whether he or she was read to when young.
The evocative and active effects of the genotype help explain how children’s IQ scores become more closely related over time to those of their biological parents, even if the children are adopted and never see their biological parents.
Influence of the Immediate Environment
The influence of nurture on the development of intelligence begins with a child’s immediate environment of families and schools.
Family Influences
If asked to identify the most important environmental influence on their intelligence, most people probably would say, “My family.” Testing the influence of the family environment on children’s intelligence, however, requires some means of assessing that environment. How can something as complex and multifaceted as a family environment be measured, especially when it can be different for different children in the same family?
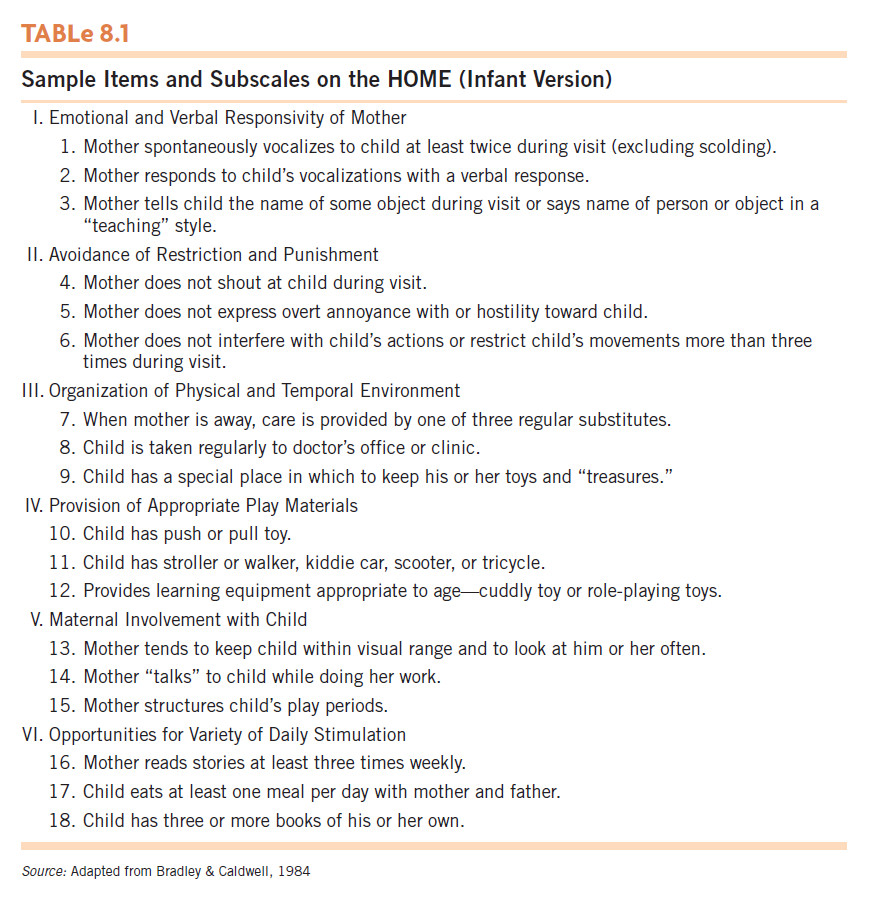
Robert Bradley and Bettye Caldwell (1979) tackled this problem by devising a measure known as the HOME (Home Observation for Measurement of the Environment). The HOME samples various aspects of children’s home life, including organization and safety of living space; intellectual stimulation offered by parents; whether children have books of their own; amount of parent–child interaction; parents’ emotional support of the child; and so on. Table 8.1 shows the items and subscales used in the original HOME, which was designed to assess the family environments of children between birth and age 3 years. Subsequent versions of the HOME have been developed for application with preschoolers, school-aged children, and adolescents (Bradley, 1994).
Throughout childhood, children’s IQ scores, as well as their math and reading achievement scores, are positively correlated with the HOME measure of their family environment (Bradley et al., 2001). HOME scores of families of 6-month-olds correlate positively with the IQ scores of the same children at age 4 years; similarly, HOME scores of 2-year-olds correlate positively with IQ scores and school achievement of the same children at age 11 years (Olson, Bates, & Kaskie, 1992). When HOME scores are relatively stable over time, IQ scores also tend to be stable; when HOME scores change, IQ scores also tend to change in the same direction (Bradley, 1989). Thus, assessing varied aspects of a child’s family environment allows prediction of the child’s IQ score.
311

Given this evidence, it is tempting to conclude that better-quality home environments cause children to have higher IQ scores. Whether that is actually the case, however, is not yet known. The uncertainty reflects two factors. First, the type of intellectual environment that parents establish in the home is almost certainly influenced by their genetic makeup. Second, almost all studies using the HOME have focused on families in which children live with their biological parents.
312

These two circumstances may mean that parents’ genes influence both the intellectual quality of the home environment and children’s IQ scores; thus, the home intellectual environment as such may not cause children to have higher or lower IQ. Consistent with this possibility, in the few studies in which the HOME has been used to study adoptive families, the correlations between it and children’s IQ scores are lower than in studies of children living with their biological parents (Plomin, Fulker et al., 1997). Thus, although scores on the HOME clearly correlate with children’s IQ scores, whether causal relations exist between the two remains uncertain.
Shared and Nonshared Family Environments The phrase “family intellectual environment” is often taken to mean characteristics that are the same for all children within the family: the parents’ emphasis on education, the number of books in the house, the frequency of intellectual discussions around the dinner table, and so on. As discussed in Chapter 3, however, each child within a given family also encounters unique, nonshared environments. In any family, only one child can be the firstborn and receive the intense, undivided parental attention early in life that this status tends to bring. Similarly, a child whose interests or personality characteristics mirror those of one or both parents may receive more positive attention than other children in the family. If homes that are extremely lacking in intellectual stimulation are excluded from consideration, such within-family variations in children’s environment may have a greater impact on the development of intelligence than do between-family variations (Petrill et al., 2004). In addition, the influence of the nonshared environment increases with age, and the influence of the shared environment decreases with age, as children become increasingly able to choose their own friends and activities (Bouchard, 2004; Segal et al., 2007).
The relative influence of shared environments and genetics varies with family income. Among children and adolescents from low-income families, the shared environment accounts for more of the variance in IQ scores and academic achievement than genetics does. In contrast, among children and adolescents from middle- and high-income families, the relative influence of shared environment and genetics is reversed (Harden, Turkheimer, & Loehlin, 2007; D. C. Rowe, Jacobson, & Van den Oord, 1999; Turkheimer et al., 2003). These differing patterns are found as early as age 2 years (Tucker-Drob et al., 2011). The reasons for the differences remain to be established.
Influences of Schooling
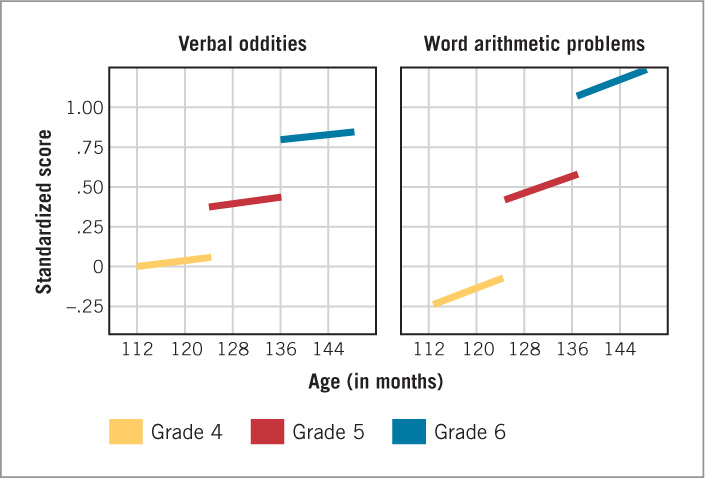
Attending school makes children smarter. One type of evidence for this conclusion came from a study that examined IQ scores of older and younger Israeli children within the 4th, 5th, and 6th grades (Cahan & Cohen, 1989). As indicated by the gradual upward trends in the graphs in Figure 8.6, older children within each grade did somewhat better than younger children within that grade on each part of the test. However, the jumps in the graphs between grades indicate that children who were only slightly older, but who had a year more schooling, did much better than the slightly younger children in the grade below them. For example, on the verbal-oddities subtest (which involves indicating which word in a series does not belong with the others), the results show a small gap between 123- and 124-month-old 4th-graders but a large gap between both of them and 125-month-old 5th-graders.
313
Another type of evidence indicating that going to school makes children smarter is that average IQ and achievement test scores rise during the school year but not during summer vacation (Ceci, 1991; J. Huttenlocher, Levine, & Vevea, 1998). The way in which these changes vary with children’s family backgrounds adds further support to the view that schooling makes children smarter. Children from families of low socioeconomic status and those from families of high socioeconomic status make comparable gains in school achievement during the school year. However, over the summer, the achievement test scores of low-SES children tend to stay constant or drop, whereas the scores of high-SES children tend to rise (K. L. Alexander, Entwisle, & Olson, 2007; Burkam et al., 2004). The likely explanation is that during the academic year, schools provide children of all backgrounds with relatively stimulating intellectual environments, but when school is not in session, fewer children from low-SES families have the kinds of experiences that allow them to build on what they learned to increase their academic achievement.
Influence of Society
Flynn effect  consistent rise in average IQ scores that has occurred over the past 80 years in many countries
Intellectual development is influenced not only by characteristics of children, their families, and their schools but also by broader characteristics of the societies within which children develop. One reflection of societal influences is that in many countries throughout the world, average IQ scores have consistently risen over the past 80 years, a phenomenon that has been labeled the Flynn effect in honor of James Flynn, the researcher who discovered this widespread trend (Flynn, 1987; 2009). In some countries, including the Netherlands and Israel, average IQ scores have risen as much as 20 points; in the United States, the gains have been roughly 10 points (Dickens & Flynn, 2001; Flynn & Weiss, 2007). Given that the gene pool has not changed appreciably over this period, the increase in IQ scores must be due to changes in society.
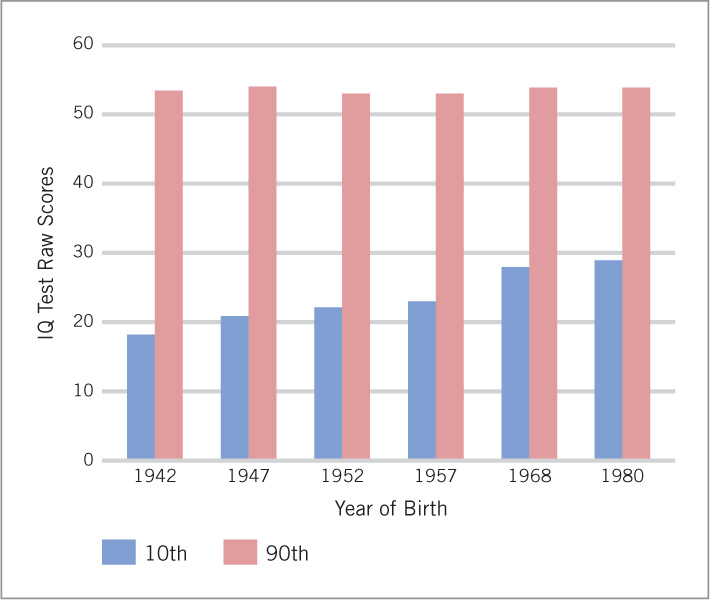
The specific source of the Flynn effect remains controversial. Some researchers argue that the key factors are improvements in the lives of low-income families, such as improved nutrition (Lynn, 2009), health (Eppig, Fincher, & Thornhill, 2010), and formal education (C. Blair et al., 2005), These researchers point to evidence that the increase in IQ scores has been greatest among those in the lower part of the IQ score and income distributions. For example, as shown in Figure 8.7, among Danes born from 1942 to 1980, there was no change in the scores of people in the top 10% of the IQ distribution, but there was a large change among those in the bottom 10% (Geary, 2005). IQ score changes in some other countries, including Spain and Norway, show a similar pattern, but gains in yet other countries, including the United States, France, and Britain, have been comparable throughout the IQ score and income distributions (Nisbett et al., 2012). In the United States, gains in intellectual achievement have occurred even in the top 5% of the population (Wai, Putallaz, & Makel, 2012).
314
An alternative plausible explanation for the increases in IQ scores is increased societal emphasis on abstract problem solving and reasoning (Flynn, 2009). Supporting this interpretation is the fact that scores on tests of fluid intelligence, which reflects abstract problem solving and reasoning, have increased much more than scores on tests of crystallized intelligence (Nisbett et al., 2012). One source of these recent increases in fluid intelligence might be experience with new technologies, such as video games. Haier and colleagues (2009) found that 3 months of playing a video game (Tetris) led to increased brain thickness in areas of adolescent girls’ brains that are specifically activated by playing the game and that are also active in the types of spatial tasks that are often used to measure fluid intelligence.
One conclusion that sparks no controversy is that poverty hinders intellectual development. In the following sections, we consider how poverty affects children’s development in different societies, and how it contributes to differences in IQ scores and school achievement among different racial and ethnic groups within the United States. We will also consider risk factors associated with poverty that adversely affect intelligence, as well as programs that enhance poor children’s intellectual development.
Effects of Poverty
The negative effects of poverty on children’s IQ scores are indisputable. Even after taking into account the mother’s education, whether both parents live with the child, and the child’s race, the adequacy of family income for meeting family needs is related to children’s IQ scores (Duncan et al., 1998). Further, the more years children spend in poverty, the lower their scores tend to be (Korenman, Miller, & Sjaastad, 1995).
Poverty exerts negative effects on intellectual development in numerous ways. Chronic inadequate diet early in life can disrupt brain development; missing meals on a given day (e.g., achievement test day) can impair intellectual functioning on that day; reduced access to health services can result in greater numbers of absences from school; conflicts between adults in the household can produce emotional turmoil that interferes with learning; insufficient intellectual stimulation can lead to a lack of background knowledge needed to understand new material; and so on.
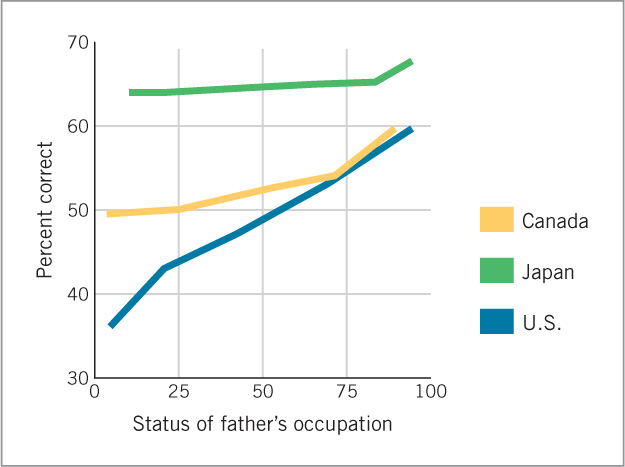
One source of evidence for the relation between poverty and IQ is the fact that in all countries that have been studied, children from wealthier homes score higher on IQ and achievement tests, on average, than do children from poorer homes (Case, Griffin, & Kelley, 1999; Keating & Hertzman, 1999). More telling, in those developed countries where the income gap between rich and poor is widest, such as the United States, the difference between the intellectual achievement of children from rich and poor homes is much larger than in countries in which the gap is smaller, such as the Scandinavian countries and, to a lesser degree, Germany, Canada, and Great Britain. As shown in Figure 8.8, children from affluent families in the United States score, on average, about the same on mathematics achievement tests as children from affluent families in some comparison countries with greater income equality. In contrast, children from poor families in the United States have average achievement test scores far below children from poor families in those same comparison countries. The key difference is that poor families in the United States are much poorer, relative to others in their society, than their counterparts in many other developed countries. Thus, in 2011, 23% of children in the United States lived in families with incomes below half that of the median U.S. family income. By contrast, in a set of 35 other developed countries, only 11% of children were from families with this low a percentage of the median income in their country (UNICEF, 2012).
315
As noted in Chapter 1, within the United States, the percentage of children living in poor families is much higher among Hispanic Americans and African Americans than among European Americans and Asian Americans and is much higher in families headed by a single female than in families headed by a married couple. These economic differences help explain the group differences in IQ scores that we examine in the next section.
Race, Ethnicity, and Intelligence
Few claims stir stronger passions than those surrounding assertions that racial and ethnic groups differ in intelligence. It is therefore especially important to know both the facts about this issue and what can and cannot be concluded from them.
One fact is that the average IQ scores of children from different racial and ethnic groups do differ. For example, the average IQ score of European American children is about 10 points higher than that of African American children (Dickens & Flynn, 2006). The average scores of Hispanic American and Native American children are a few points higher than those of African American children, and those of Asian American children are a few points higher than those of European Americans (Nisbett et al., 2012). These differences are explained in part by differences in social-class backgrounds. Within each social class, however, differences in mean IQ scores of African American and European American children also are present, though they are smaller than those that are present when social class is not held constant (L. A. Suzuki & Valencia, 1997).
A second fact is that scientific statements about group differences in IQ scores refer to statistical averages rather than to any individual’s score. Understanding this second fact is essential for interpreting the first. Millions of African American children have IQ scores higher than the average European American child, and millions of European American children have IQ scores lower than the average African American child. Far more variability exists within each racial group than between them. Thus, data on the average IQ score of members of an ethnic or racial group tell us nothing about a given individual.
A third crucial fact is that differences in IQ and achievement test scores of children from different racial and ethnic groups describe children’s performance only in the environments in which the children live. The findings do not indicate their intellectual potential, nor do they indicate what their scores would be if the children lived in different environments. Indeed, with decreases in discrimination and inequality in the past 40 years, achievement test differences between European American and African American children decreased considerably. A rigorous analysis of changes over time in intelligence test scores showed that African American schoolchildren reduced the gap with European American schoolchildren by 4 to 7 points between 1972 and 2002 (Dickens & Flynn, 2006); achievement test scores have shown the same trend (N. Brody, 1992).
Risk Factors and Intellectual Development
In the popular media, reports on how to help all children reach their intellectual potential often focus on a single factor—the need to eliminate poverty or the need to eliminate racism or the need to preserve two-parent families, or the need for high-quality day care, or the need for universal preschool education, and so on. However, no single factor, nor even any small group of factors, is the key. Instead, a variety of factors in combination contribute to the problem of poor intellectual development.
316
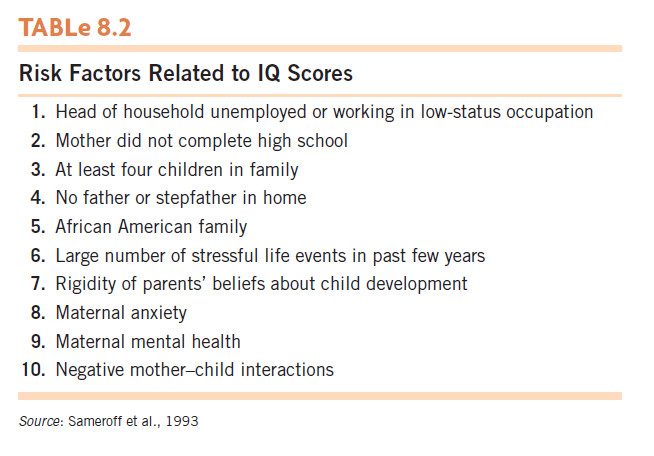
To capture the impact of these multiple influences, Arnold Sameroff and his colleagues developed an environmental risk scale (Sameroff et al., 1993) based on 10 features of the environment that put children at risk for low IQ scores (Table 8.2). Each child’s risk score is a simple count of the number of major risks facing the child. Thus, a child growing up with, say, a mother who is unemployed, unmarried, highly anxious, and mentally ill would have an environmental risk score of 4.
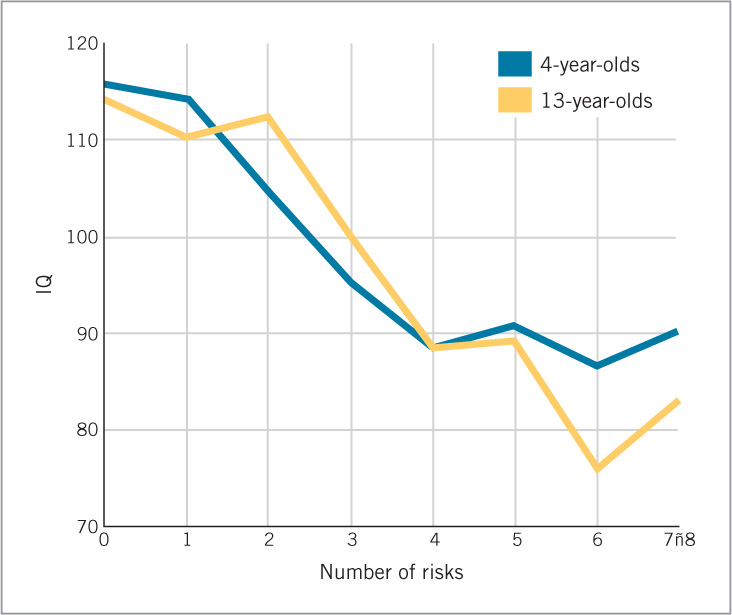
Sameroff and his colleagues measured the IQ scores and environmental risks of more than 100 children when they were 4-year-olds and again when they were 13-year-olds. They found that the more risks in a child’s environment, the lower the child’s IQ score tended to be. As shown in Figure 8.9, the effect was large. The average IQ score of children whose environments did not include any of the risk factors was around 115; the average score of children whose environments included six or more risks was around 85. The sheer number of risks in the child’s environment was a better predictor of the child’s IQ score than was the presence of any particular risk. Subsequent studies demonstrated similarly strong relations between the number of risk factors and school grades (Gassman-Pines & Yoshikawa, 2006; Gutman, Sameroff, & Cole, 2003).
The Sameroff (1993) study also provided an interesting perspective on why children’s IQ scores are highly stable. It is not just that children’s genes remain constant; over time, their environment tends to remain fairly constant as well. The study revealed that there was just as much stability in the number of risk factors in children’s environments at ages 4 and 13 years as there was in their IQ scores over that period.
The number of risk factors in a 4-year-old’s environment not only correlates highly with the child’s IQ score at age 4 but also predicts likely changes in the child’s score between ages 4 and 13. That is, if two children have the same IQ score at age 4 but one child lives in an environment with more risk factors, the child facing more risks will, at age 13, probably have an IQ score lower than that of the other child. Thus, environmental risks seem to have both immediate and long-term effects on children’s intellectual development. Genetic contributions cannot be ruled out—anxiety, poor mental health, and other risk factors may be biologically transmitted from parent to child—but a greater number of risk factors is definitely associated with lower IQ scores.
Although Sameroff and his colleagues described their measure as a “risk index,” it is as much a measure of the quality of a child’s environment as of its potential for harm. High IQ scores are associated with favorable environments as much as low scores are associated with adverse ones. This is true for children from low-income families as well as for children in general. Low-income parents who, relative to others with similar incomes, are responsive to their children and provide them with safe play areas and varied learning materials have children with higher IQ scores (Bradley et al., 1994). Thus, high-quality parenting can help alleviate the risks imposed by poverty.
317
Programs for Helping Poor Children
During the early 1960s, a political consensus developed in the United States that helping children from poor families was an urgent national priority. Psychological research contributed to this consensus by demonstrating that children’s environments had significant effects on their cognitive growth (W. Dennis & Najarian, 1957; J. M. Hunt, 1961). As a consequence, over the next decade, many intervention programs were initiated to enhance the intellectual development of preschoolers from impoverished families.
In a comprehensive analysis of 11 of the most prominent early-intervention programs—all of which focused on 2- to 5-year-old African American children from low-income families—Irving Lazar and his colleagues found a consistent pattern (Lazar et al., 1982). Participation in the programs, most of which lasted a year or two, initially increased children’s IQ scores substantially—by 10 to 15 points. However, over the next 2 or 3 years, the gains decreased, and by the 4th year after the end of the programs, no differences were apparent between the IQ scores of participants and those of nonparticipants from the same neighborhoods and backgrounds. Similar patterns emerged in an analysis of programs that emphasized mathematics and reading achievement (McKey et al., 1985).
Fortunately, other effects of these experimental programs were more enduring. Only half as many program participants as nonparticipants were later assigned to special-education classes—14% versus 29%. Similarly, fewer participants were held back in school, more participants subsequently graduated from high school, and fewer had been arrested by age 18 (Reynolds et al., 2001).
This combination of findings may seem puzzling. If the intervention programs did not result in lasting increases in IQ or achievement test scores, why would they have led to fewer children being assigned to special-education classes or being held back in school? A likely reason is that the interventions had long-term effects on children’s motivation and behavior. These effects would help children do well enough in the classroom to be promoted with their classmates, which in turn might make them less likely to drop out of high school and less likely to turn to criminal activity, even if their IQ scores were unchanged.
Participation also led to benefits after children finished school. As adults, former participants in some of the programs used the welfare system less and earned larger salaries than did nonparticipants (Haskins, 1989; McLoyd, 1998). Positive effects such as these suggest that early-intervention programs not only can help participants lead more successful lives but might also more than repay their costs by reducing the need for social services. As discussed in Box 8.2, at least one specialized, intensive program has shown the possibility of producing enduring gains in IQ score and school achievement as well.
Project Head Start In response to the same political consensus of the 1960s that led to small-scale early-intervention programs, the U.S. government initiated a large-scale intervention program: Project Head Start. In the past 50 years, this program has provided a wide range of services to more than 25 million children.
318
Box 8.2: applications
A Highly Successful Early Intervention: The Carolina Abecedarian Project
Carolina Abecedarian Project comprehensive and successful enrichment program for children from low-income families
The difficulty of producing enduring gains in poor children’s IQ and achievement test scores led some evaluators to conclude that intelligence is unalterable (A. R. Jensen, 1973; Westinghouse Learning Corporation, 1969). However, the same findings motivated other researchers to find out if interventions that started in infancy, continued for a number of years, and attempted to improve many aspects of children’s lives might produce enduring increases in IQ, even though briefer, less intensive, later-starting efforts had not. One intervention that has yielded a positive answer to these questions is the Carolina Abecedarian Project, a program that clearly illustrates the theme of how research can improve children’s welfare (F. A. Campbell & Ramey, 2007; Ramey & Ramey, 2004).
Children were selected to participate in the Abecedarian (pronounced “a-bee-cee-darian”) program on the basis of low family income, the absence of a father in the home, low maternal IQ score and education, and other factors that put the children at risk for developmental problems. More than 95% of the children who participated were African American. The program was based on seven principles (Ramey & Ramey, 2004):
- Encourage exploration.
- Mentor basic skills.
- Celebrate developmental advances.
- Rehearse and generalize new skills.
- Protect children from inappropriate disapproval, teasing, and punishment.
- Communicate richly and responsively.
- Guide and limit behavior.
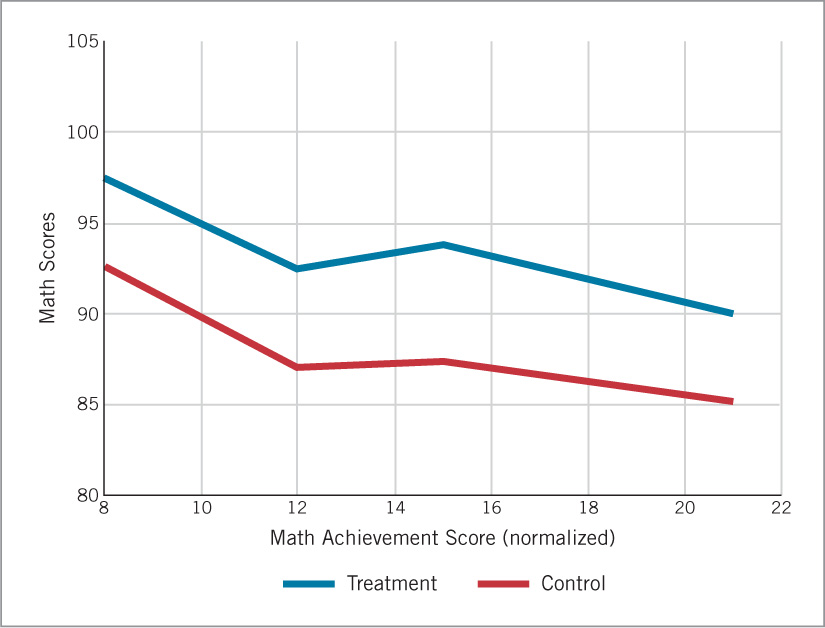
Children in the program began attending a special day-care center by the time they were 6-month-olds and continued to do so through the age of 5 years. They were at the center for the entire working day (7:45 a.m. to 5:30 p.m.), 5 days per week, 50 weeks per year, for 5 years. The teacher–child ratio was optimal: 1:3 for children aged 3 years and younger and 1:6 for 4- and 5-year-olds. Children aged 3 years and younger received a program that emphasized general social, cognitive, and motor development; for 4- and 5-year-olds, the program also provided systematic instruction in math, science, reading, and music. At all ages, the program emphasized language development and ensured extensive verbal communication between teachers and children. Program personnel also worked with the children’s mothers outside the day-care center to improve their understanding of child development. Families of children in the experimental program were provided with nutritional supplements and access to high-quality health care. Families of children in a control group received similar nutritional and health benefits, but the children did not attend the day-care center.
This well-planned, multifaceted program proved to have lasting positive effects on the IQ scores and achievement levels of children in the experimental group. At the age of 21 years, 15 years after the program had ended, these children had mean IQ scores 5 points higher than the children in the control group: 90 versus 85 (F. A. Campbell et al., 2001). Participants’ achievement test scores in math and reading were also higher. As with less encompassing intervention programs, fewer participants were ever held back in school or placed in special-education classes. At age 30, a higher percentage of children in the experimental group than in the control group had graduated from college: 23% versus 6% (F. A. Campbell et al., 2012). A replication of the program demonstrated that the lower the mother’s educational level, the greater the difference the program made (Ramey & Ramey, 2004).
What lessons can be drawn from the Abecedarian Project? One important lesson is the benefit of starting interventions early and continuing them for substantial periods. A version of the Abecedarian program that ended at age 3 did not produce long-term effects on intelligence, nor did a program that provided educational support from kindergarten through 2nd grade (Burchinal et al., 1997; Ramey et al., 2000). A second crucial lesson is the need for caregivers to interact with infants in positive, responsive ways. High adult-to-infant ratios in day-care centers make such interactions more likely, as does educating staff members in the need for such interactions. A third lesson is that the gains produced by this and other successful early-intervention programs are likely due at least as much to improvements in children’s self-control and perseverance as to changes in their IQ scores (Heckman, 2011; Knudsen et al., 2006). Probably the most important lesson is the most basic: it is possible to design interventions that have substantial, lasting, positive effects on poor children’s intellectual development.
At present, Head Start serves more than 900,000 preschoolers per year, most of them 4-year-olds. The population served is racially and ethnically diverse: in 2010, 39% were African Americans, 31% European Americans, and 34% Hispanic Americans (the sum is more than 100% because small percentages of children were counted in multiple categories) (Schmit, 2011). Almost all children in Head Start are from families with incomes below the poverty line, mostly single-parent families. In the program, children receive medical and dental care and nutritious meals, and are provided with a safe environment. Many parents of participating children work as caregivers at the Head Start centers, serve on policy councils that help plan each center’s directions, and receive help with their own vocational and emotional needs.
Consistent with the findings of the smaller experimental intervention programs that have been aimed at 3- and 4-year-olds, participation in Head Start produces higher IQ and achievement test scores at the end of the program and briefly thereafter. The strongest evidence for this conclusion comes from the Head Start Impact Study (U.S. Department of Health and Human Services, 2010), an especially well-done experiment that included 5000 3- and 4-year-olds from low-income families who were on waiting lists to participate in a Head Start program. Half the children were randomly assigned to participate in Head Start; the other half followed another path of their parents’ choosing. The children comprised a nationally representative sample of the low-income population, and the Head Start centers in which the children enrolled were representative in terms of their quality.
319
The children who participated in Head Start showed better prereading and prewriting skills (though no better math skills) at the end of a year in the program (U.S. Department of Health and Human Services, 2005). By the end of 1st grade, however, children’s intellectual outcomes were almost identical to those of nonparticipants (U.S. Department of Health and Human Services, 2010). Less extensive evaluations of Head Start have obtained similar findings (McKey et al., 1985; McLoyd, 1998).
On the other hand, participation in Head Start produces a number of other positive effects that do endure, ones that resemble those produced by the experimental preschool programs: improved social skills and health, lower frequency of being held back in school, greater likelihood of graduating from high school and enrolling in college, and lower rates of drug use and delinquency (Love, Chazan-Cohen, & Raikes, 2007; Zigler & Styfco, 2004). These important gains have contributed to the enduring popularity of Head Start.
320

review:
The development of intelligence is influenced by qualities of the child, the immediate environment, and the broader society. The child’s genetic inheritance exerts a large influence, especially for children from middle- and upper-income families; this influence steadily increases over the course of development. The intellectual environment provided by the child’s family and the schooling the child encounters are also influential, as are the family’s economic status and educational level and whether one or two parents are present. For children from low-income backgrounds, these shared aspects of the environment exert a stronger influence than do children’s genes on differences in their intellectual development. The impact of society is evident in the Flynn effect, which reflects the consistent rise in IQ scores in all economically advanced countries.
Programs such as Project Head Start are often beneficial in a variety of ways, though their effect on IQ and achievement test scores usually fades over time. However, at least one early-intervention program, the Abecedarian Project, reports enduring positive effects on IQ scores and achievement.