EXAMPLE 4Graphing a Function of Two Variables
Graph each function:
- (a) z=f(x,y)=1−x−y
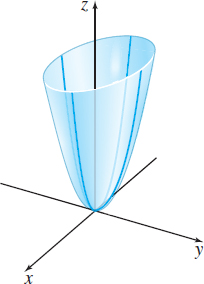
- (b) z=f(x,y)=x2+4y2
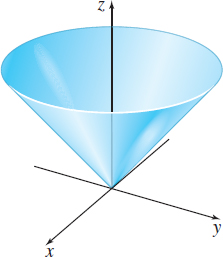
- (c) z=f(x,y)=√x2+y2
Planes in space are discussed in Section 10.6, pp. 737-740.
Solution (a) The graph of the equation z=1−x−y, or x+y+z=1, is a plane. The intercepts are the points (1,0,0), (0,1,0), and (0,0,1). See Figure 6.
(b) The graph of the equation z=x2+4y2 is an elliptic paraboloid whose vertex is at the origin. See Figure 7.
Quadric surfaces are discussed in Section 10.7, pp. 744-751.
(c) The equation z=f(x,y)=√x2+y2 is equivalent to z2=x2+y2, where z≥0. The graph of the equation is part of a circular cone whose vertex is at the origin. Since z≥0, the graph of f is the upper nappe of the cone. See Figure 8.
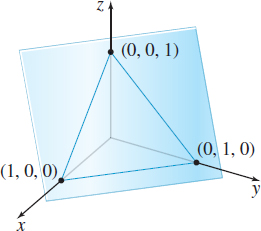
Figure 6 z=f(x,y)=1−x−y