17-9 Observing binary star systems reveals the masses of stars
For main-sequence stars, there is a direct correlation between mass and luminosity
 We now know something about the sizes, temperatures, and luminosities of stars. To complete our picture of the physical properties of stars, we need to know their masses. In this section, we will see that stars come in a wide range of masses. We will also discover an important relationship between the mass and luminosity of main-sequence stars. This relationship is crucial to understanding why some main-sequence stars are hot and luminous, while others are cool and dim. It will also help us understand what happens to a star as it ages and evolves.
Determining the masses of stars is not trivial, however. The problem is that there is no practical, direct way to measure the mass of an isolated star. Fortunately for astronomers, about half of the visible stars in the night sky are not isolated individuals. Instead, they are multiple-star systems, in which two or more stars orbit each other. By carefully observing the motions of these stars, astronomers can glean important information about their masses.
Binary Stars
A pair of stars located at nearly the same position in the night sky is called a double star. The Anglo-German astronomer William Herschel made the first organized search for such pairs. Between 1782 and 1821, he published three catalogs listing more than 800 double stars. Late in the nineteenth century, his son, John Herschel, discovered 10,000 more doubles. Some of these double stars are optical double stars, which are two stars that lie along nearly the same line of sight but are actually at very different distances from us. But many double stars are true binary stars, or binaries—pairs of stars that actually orbit each other. Figure 17-20 shows an example of this orbital motion.
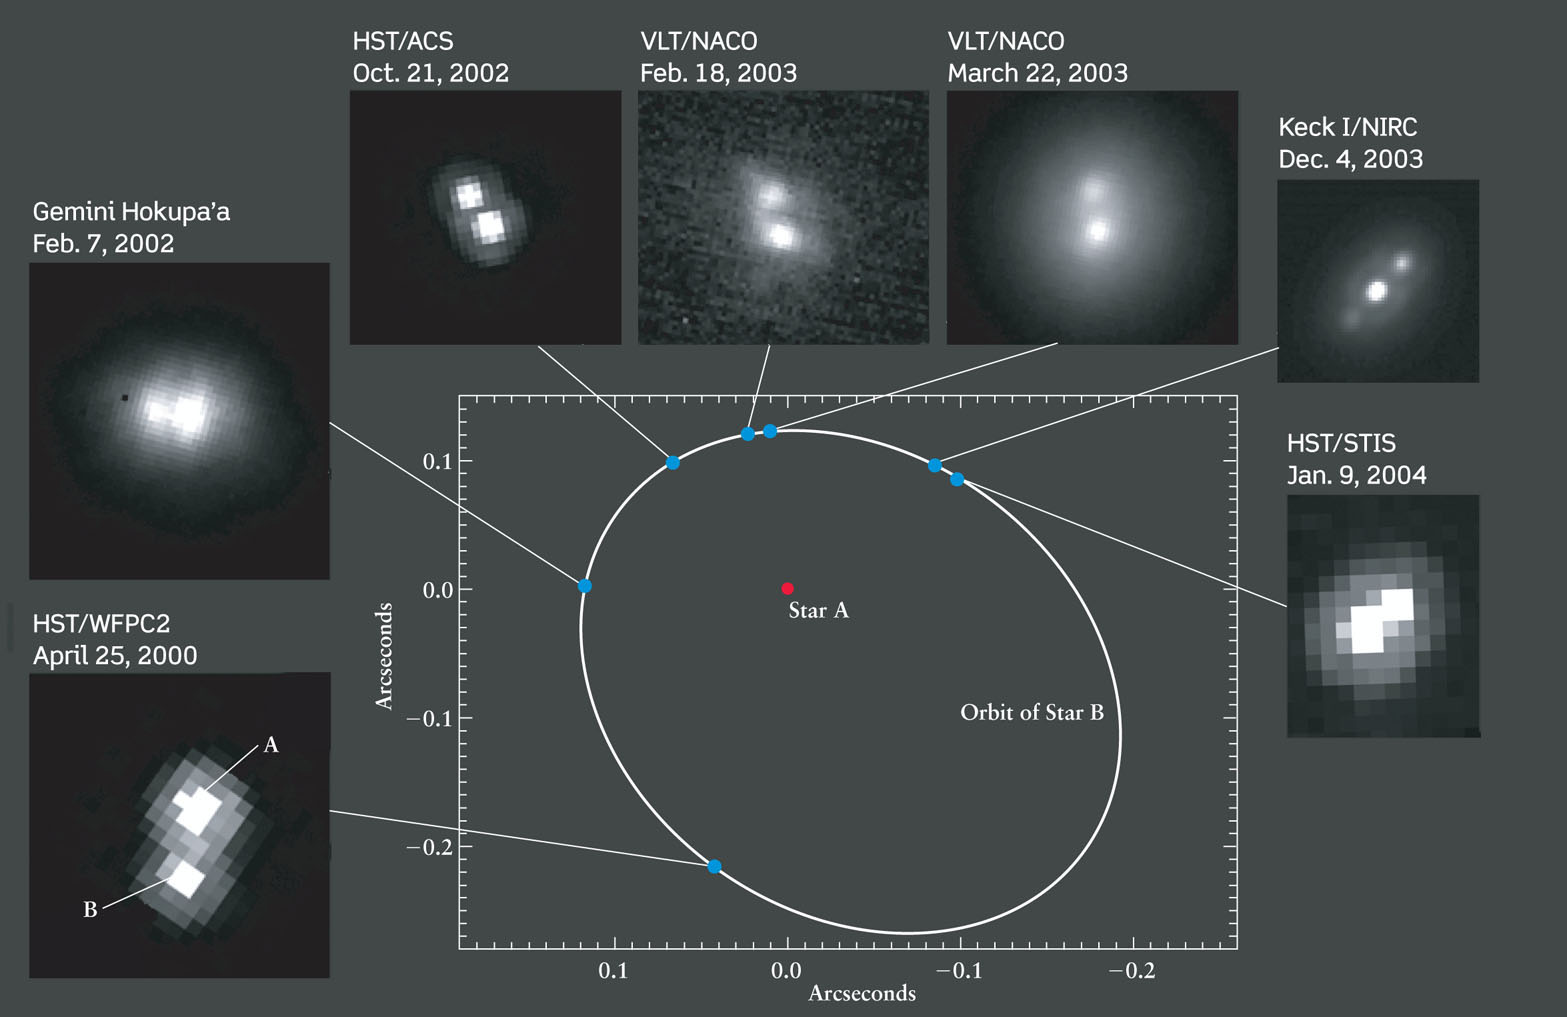
A Binary Star System As seen from Earth, the two stars that make up the binary system called 2MASSW J0746425+2000321 are separated by less than ⅓ arcsecond. The images surrounding the center diagram show the relative positions of the two stars over a four-year period. These images were made by the Hubble Space Telescope (HST), the European Southern Observatory’s Very Large Telescope (VLT), and Keck I and Gemini North in Hawaii (see Figure 6-16). For simplicity, the diagram shows one star as remaining stationary; in reality, both stars move around their common center of mass.
When astronomers can actually see the two stars orbiting each other, a binary is called a visual binary. By observing the binary over an extended period, astronomers can plot the orbit that one star appears to describe around the other, as shown in the center diagram in Figure 17-20.
In fact, both stars in a binary system are in motion. They orbit each other because of their mutual gravitational attraction, and their orbital motions obey Kepler’s third law as formulated by Isaac Newton (see Section 4-7 and Box 4-4). This law can be written as follows:
Kepler’s third law for binary star systems
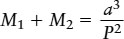
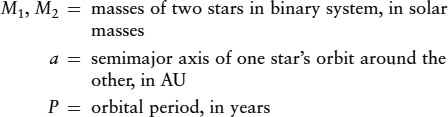
Here a is the semimajor axis of the elliptical orbit that one star appears to describe around the other, plotted as in the center diagram in Figure 17-20. As this equation indicates, if we can measure this semimajor axis (a) and the orbital period (P), we can learn something about the masses of the two stars.
In principle, the orbital period of a visual binary is easy to determine. All you have to do is see how long it takes for the two stars to revolve once about each other. The two stars shown in Figure 17-20 are relatively close, about 2.5 AU on average, and their orbital period is only 10 years. Many binary systems have much larger separations, however, and the period may be so long that more than one astronomer’s lifetime is needed to complete the observations.
Determining the semimajor axis of an orbit can also be a challenge. The angular separation between the stars can be determined by observation. To convert this angle into a physical distance between the stars, we need to know the distance between the binary and Earth. This distance can be found from parallax measurements or by using spectroscopic parallax. The astronomer must also take into account how the orbit is tilted to our line of sight.
Once both P and a have been determined, Kepler’s third law can be used to calculate M1 + M2, the sum of the masses of the two stars in the binary system. But this analysis tells us nothing about the individual masses of the two stars. To obtain these masses, more information about the motions of the two stars is needed.
Each of the two stars in a binary system actually moves in an elliptical orbit about the center of mass of the system. Imagine two children sitting on opposite ends of a seesaw (Figure 17-21a). For the seesaw to balance properly, they must position themselves so that their center of mass—an imaginary point that lies along a line connecting their two bodies—is at the fulcrum, or pivot point of the seesaw. If the two children have the same mass, the center of mass lies midway between them, and they should sit equal distances from the fulcrum. If their masses are different, the center of mass is closer to the heavier child.
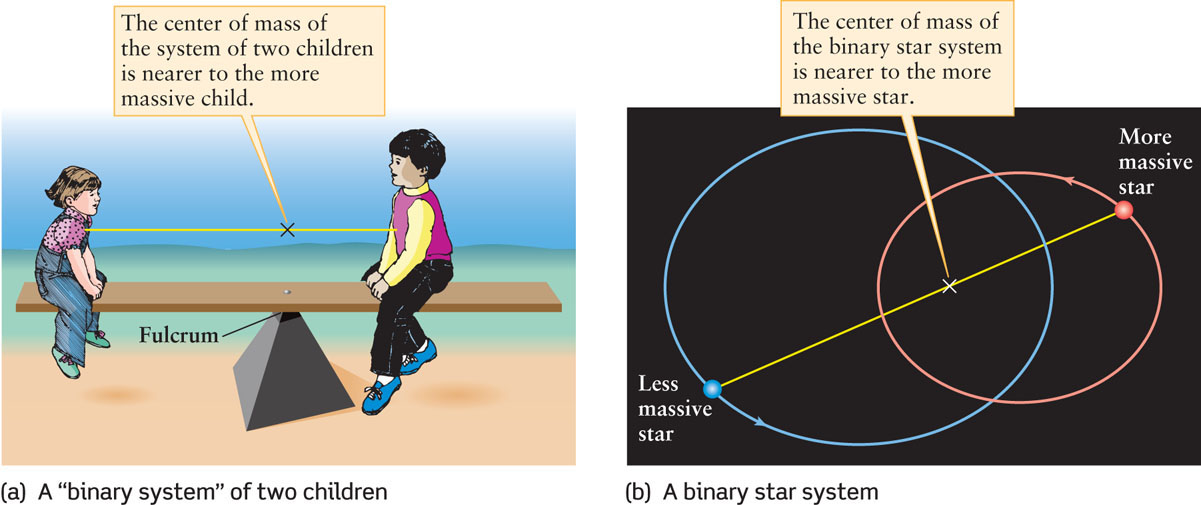
 Center of Mass in a Binary Star System (a) A seesaw balances if the fulcrum is at the center of mass of the two children. (b) The members of a binary star system orbit around the center of mass of the two stars. Although their elliptical orbits cross each other, the two stars are always on opposite sides of the center of mass and thus never collide.
Just as the seesaw naturally balances at its center of mass, the two stars that make up a binary system naturally orbit around their center of mass (Figure 17-21b). The center of mass always lies along the line connecting the two stars and is closer to the more massive star.
The center of mass of a visual binary is located by plotting the separate orbits of the two stars, as in Figure 17-21b, using the background stars as reference points. The center of mass lies at the common focus of the two elliptical orbits. Comparing the relative sizes of the two orbits around the center of mass yields the ratio of the two stars’ masses, M1/M2. With the sum M1 + M2 already known from Kepler’s third law, the individual masses of the two stars can then be determined using algebra.
CONCEPT CHECK 17-18
If two stars in a binary system were moved farther apart, how would their masses and orbital periods change?
If two stars orbiting a common center of mass were moved farther apart, their masses would not change, but the period would increase following Kepler’s third law.
Main-Sequence Masses and the Mass-Luminosity Relation
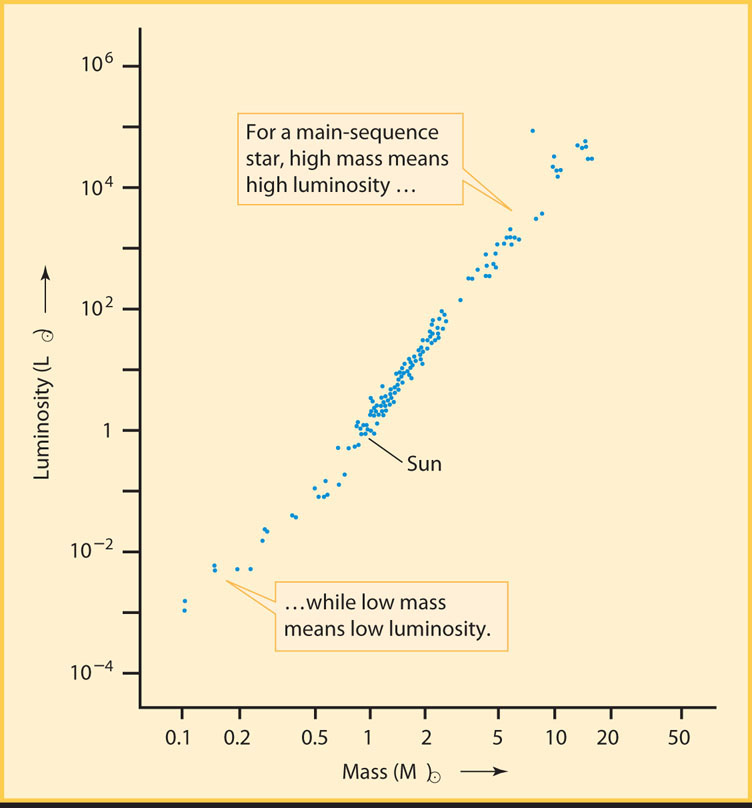
Years of careful, patient observations of binaries have slowly yielded the masses of many stars. As the data accumulated, an important trend began to emerge: For main-sequence stars, there is a direct correlation between mass and luminosity. The more massive a main-sequence star, the more luminous it is. Figure 17-22 depicts this mass-luminosity relation as a graph. The range of stellar masses extends from less than 0.1 of a solar mass to more than 50 solar masses. The Sun’s mass lies between these extremes.
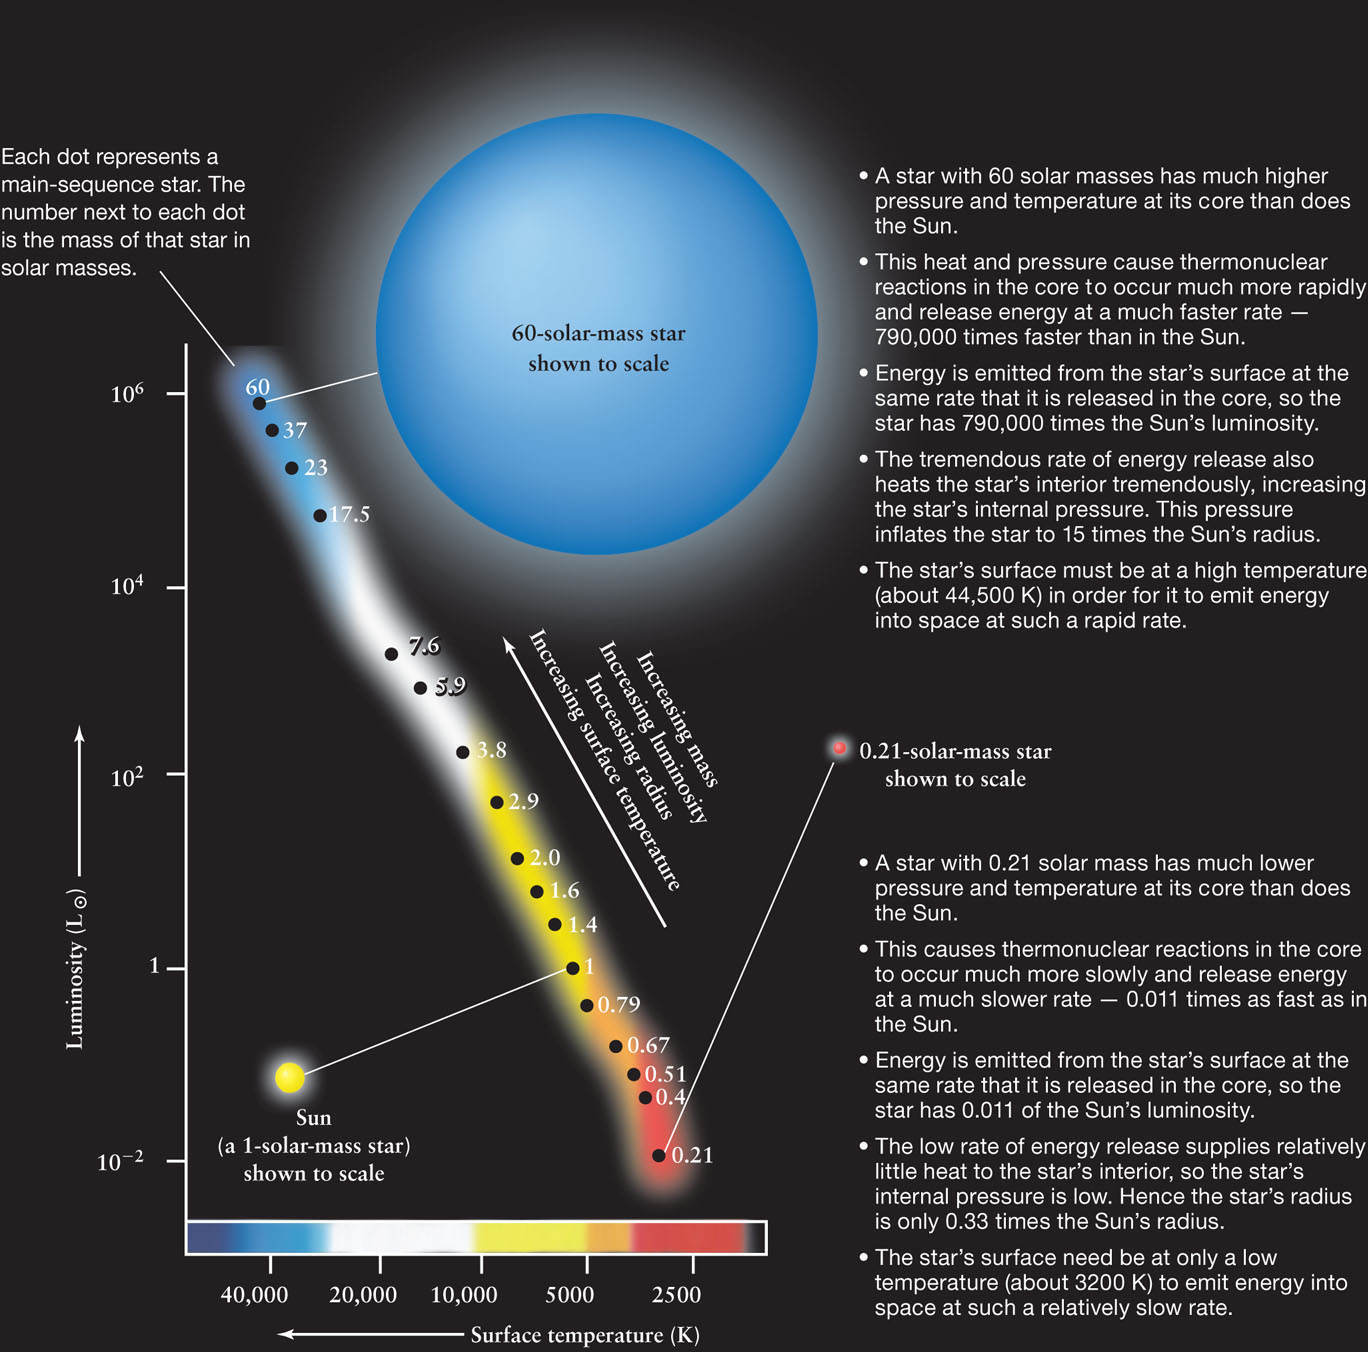
The Cosmic Connections figure depicts the mass-luminosity relation for main-sequence stars on an H-R diagram. This figure shows that the main sequence on an H-R diagram is a progression in mass as well as in luminosity and surface temperature. The hot, bright, bluish stars in the upper left corner of an H-R diagram are the most massive main-sequence stars. Likewise, the dim, cool, reddish stars in the lower right corner of an H-R diagram are the least massive. Main-sequence stars of intermediate temperature and luminosity also have intermediate masses.
COSMIC CONNECTIONS
The Main Sequence and Masses
The main sequence is an arrangement of stars according to their mass. The most massive main-sequence stars have the greatest luminosity, greatest radius, and greatest surface temperature. These characteristics are consequences of the behavior of thermonuclear reactions at the core of a main-sequence star.
The mass of a main-sequence star also helps determine its radius. Referring back to Figure 17-15b, we see that if we move along the main sequence from low luminosity to high luminosity, the radius of the star increases. Thus, we have the following general rule for main-sequence stars:
The greater the mass of a main-sequence star, the greater its luminosity, its surface temperature, and its radius.
Mass and Main-Sequence Stars
Why is mass the controlling factor in determining the properties of a main-sequence star? The answer is that all main-sequence stars are objects like the Sun, with essentially the same chemical composition as the Sun but with different masses. Like the Sun, all main-sequence stars shine because thermonuclear reactions at their cores convert hydrogen to helium and release energy. The greater the total mass of the star, the greater the pressure and temperature at the core, the more rapidly thermonuclear reactions take place in the core, and the greater the energy output—that is, the luminosity—of the star. In other words, the greater the mass of a main-sequence star, the greater its luminosity. This statement is just the mass-luminosity relation, which we can now recognize as a natural consequence of the nature of main-sequence stars.
Like the Sun, main-sequence stars are in a state of both hydrostatic equilibrium and thermal equilibrium. Calculations using models of a main-sequence star’s interior (like the solar models we discussed in Section 16-2) show that as a star settles into equilibrium, a more massive star must have a larger radius and a higher surface temperature. This result is just what we see when we plot the curve of the main sequence on an H-R diagram (see Figure 17-15b). As you move up the main sequence from less massive stars (at the lower right in the H-R diagram) to more massive stars (at the upper left), the radius and surface temperature both increase.
Calculations using hydrostatic and thermal equilibrium also show that if a star’s mass is less than about 0.08M⊙, the core pressure and temperature are too low for thermonuclear reactions to take place. The “star” (or so-called failed star) is then a brown dwarf. Brown dwarfs are still luminous; as they slowly contract, gravitational energy is converted into heat.
CAUTION!
The mass-luminosity relation we have discussed applies to main-sequence stars only. There are no simple mass-luminosity relations for giant, supergiant, or white dwarf stars. Why these stars lie where they do on an H-R diagram will become apparent when we study the evolution of stars in Chapters 19 and 20. We will find that main-sequence stars evolve into giant and supergiant stars, and that some of these eventually end their lives as white dwarfs.
CONCEPT CHECK 17-19
From the mass-luminosity relation in the Cosmic Connections figure, what can you say about the masses, temperatures, and radii for the most luminous stars?
According to the mass-luminosity relation, the most luminous main-sequence stars are also the most massive, have the largest radii, and have the greatest temperatures.