19-4 H-R diagrams and observations of star clusters reveal how red giants evolve
 To see how stars evolve during and after their main-sequence lifetimes, it is helpful to follow them on a Hertzsprung-Russell (H-R) diagram. On such a diagram, zero-age main-sequence stars lie along a line called the zero-age main sequence, or ZAMS (Figure 19-9a). These stars have just emerged from their protostar stage, are steadily fusing hydrogen into helium in their cores, and have attained hydrostatic equilibrium. With the passage of time, hydrogen in a main-sequence star’s core is converted to helium, the luminosity slowly increases, the star slowly expands, and the star’s position on the H-R diagram inches away from the ZAMS. As a result, the main sequence on an H-R diagram is a fairly broad band rather than a narrow line (Figure 19-9b).
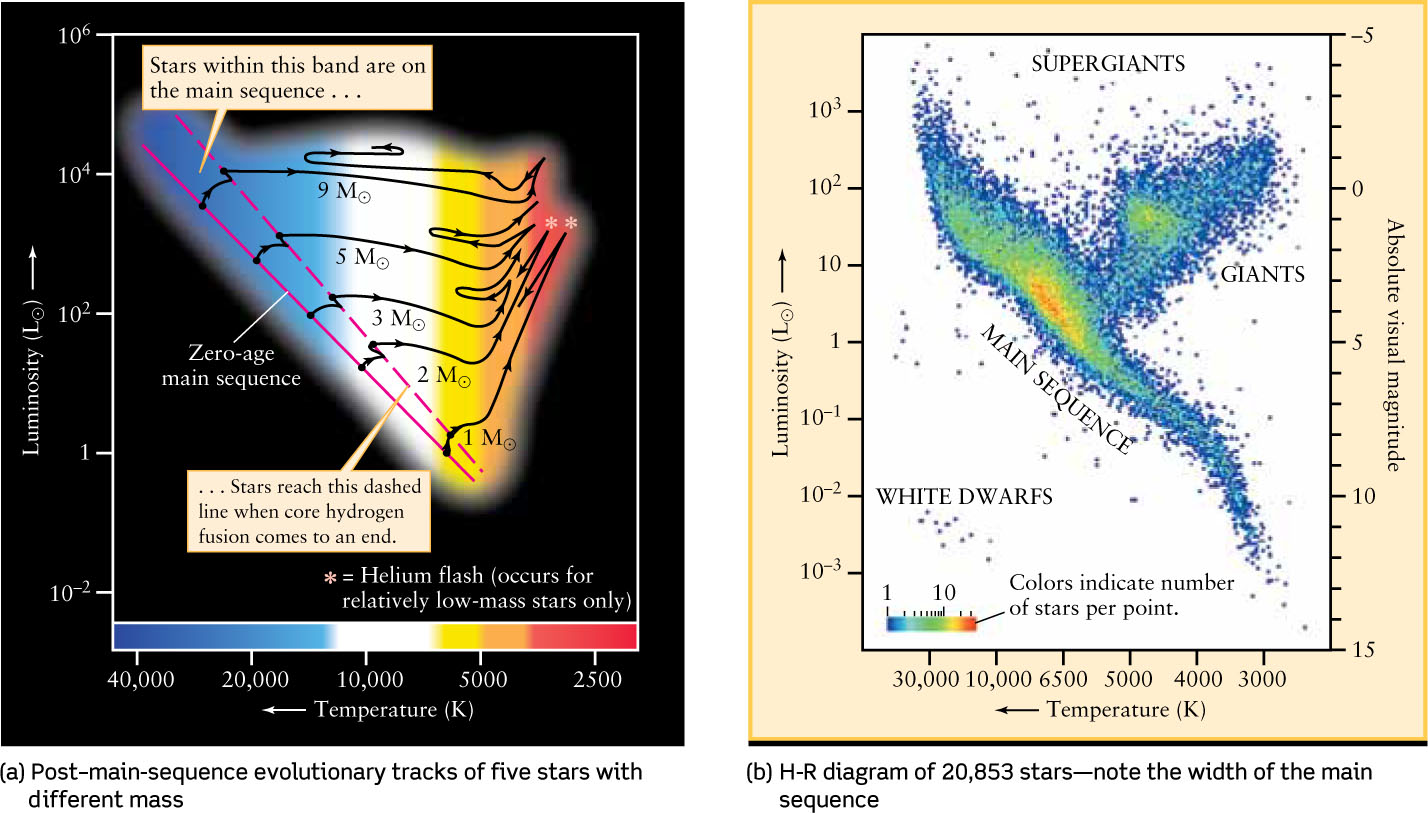
Post–Main-Sequence Evolution on an H-R Diagram
The dashed line in Figure 19-9a denotes stars whose cores have been exhausted of hydrogen and in which core hydrogen fusion has ceased. These stars have reached the ends of their main-sequence lifetimes. From there, the points representing high-mass stars (3 M⊙, 5 M⊙, and 9 M⊙) move rapidly from left to right across the H-R diagram. This means that, although the star’s surface temperature is decreasing, its surface area is increasing at a rate that keeps its overall luminosity roughly constant. During this transition, the star’s core contracts and its outer layers expand as energy flows outward from the hydrogen-fusing shell.
Just before core helium fusion begins, the evolutionary tracks of high-mass stars turn upward in the red-giant region of the H-R diagram (to the upper right of the main sequence). After core helium fusion begins, however, the cores of these stars expand, the outer layers contract, and the evolutionary tracks back away from these temporary peak luminosities. The tracks then wander back and forth in the red-giant region while the stars readjust to their new energy sources.
Figure 19-9a also shows the evolutionary tracks of two stars of moderately low mass (1 M⊙ and 2 M⊙). The onset of core helium fusion in these stars occurs with a helium flash, indicated by the red asterisks in the figure. As we saw in the previous section, after the helium flash, these stars shrink and become less luminous. The decrease in size is proportionately greater than the decrease in luminosity, and so the surface temperatures increase. Hence, after the helium flash, the evolutionary tracks for the 1-M⊙ and 2-M⊙ stars move down and to the left.
A Simulated Star Cluster: Tracking 4½ Billion Years of Stellar Evolution
We can summarize our understanding of stellar evolution from birth through the onset of helium fusion by following the evolution of a hypothetical cluster of stars. We saw in Section 18-6 that the stars that make up a cluster all begin to form at essentially the same time but have different initial masses. Hence, studying star clusters allows us to compare how stars of different masses evolve.
The eight H-R diagrams in Figure 19-10 are from a computer simulation of the evolution of 100 stars that all form at the same moment and differ only in initial mass. All 100 stars begin as cool protostars on the right side of the H-R diagram (see Figure 19-10a). The protostars are spread out on the diagram according to their masses, and the greater the mass, the greater the protostar’s initial luminosity. As we saw in Section 18-3, the source of a protostar’s luminosity is its gravitational energy. As the protostar contracts, this gravitational energy is converted to thermal energy and radiated into space.
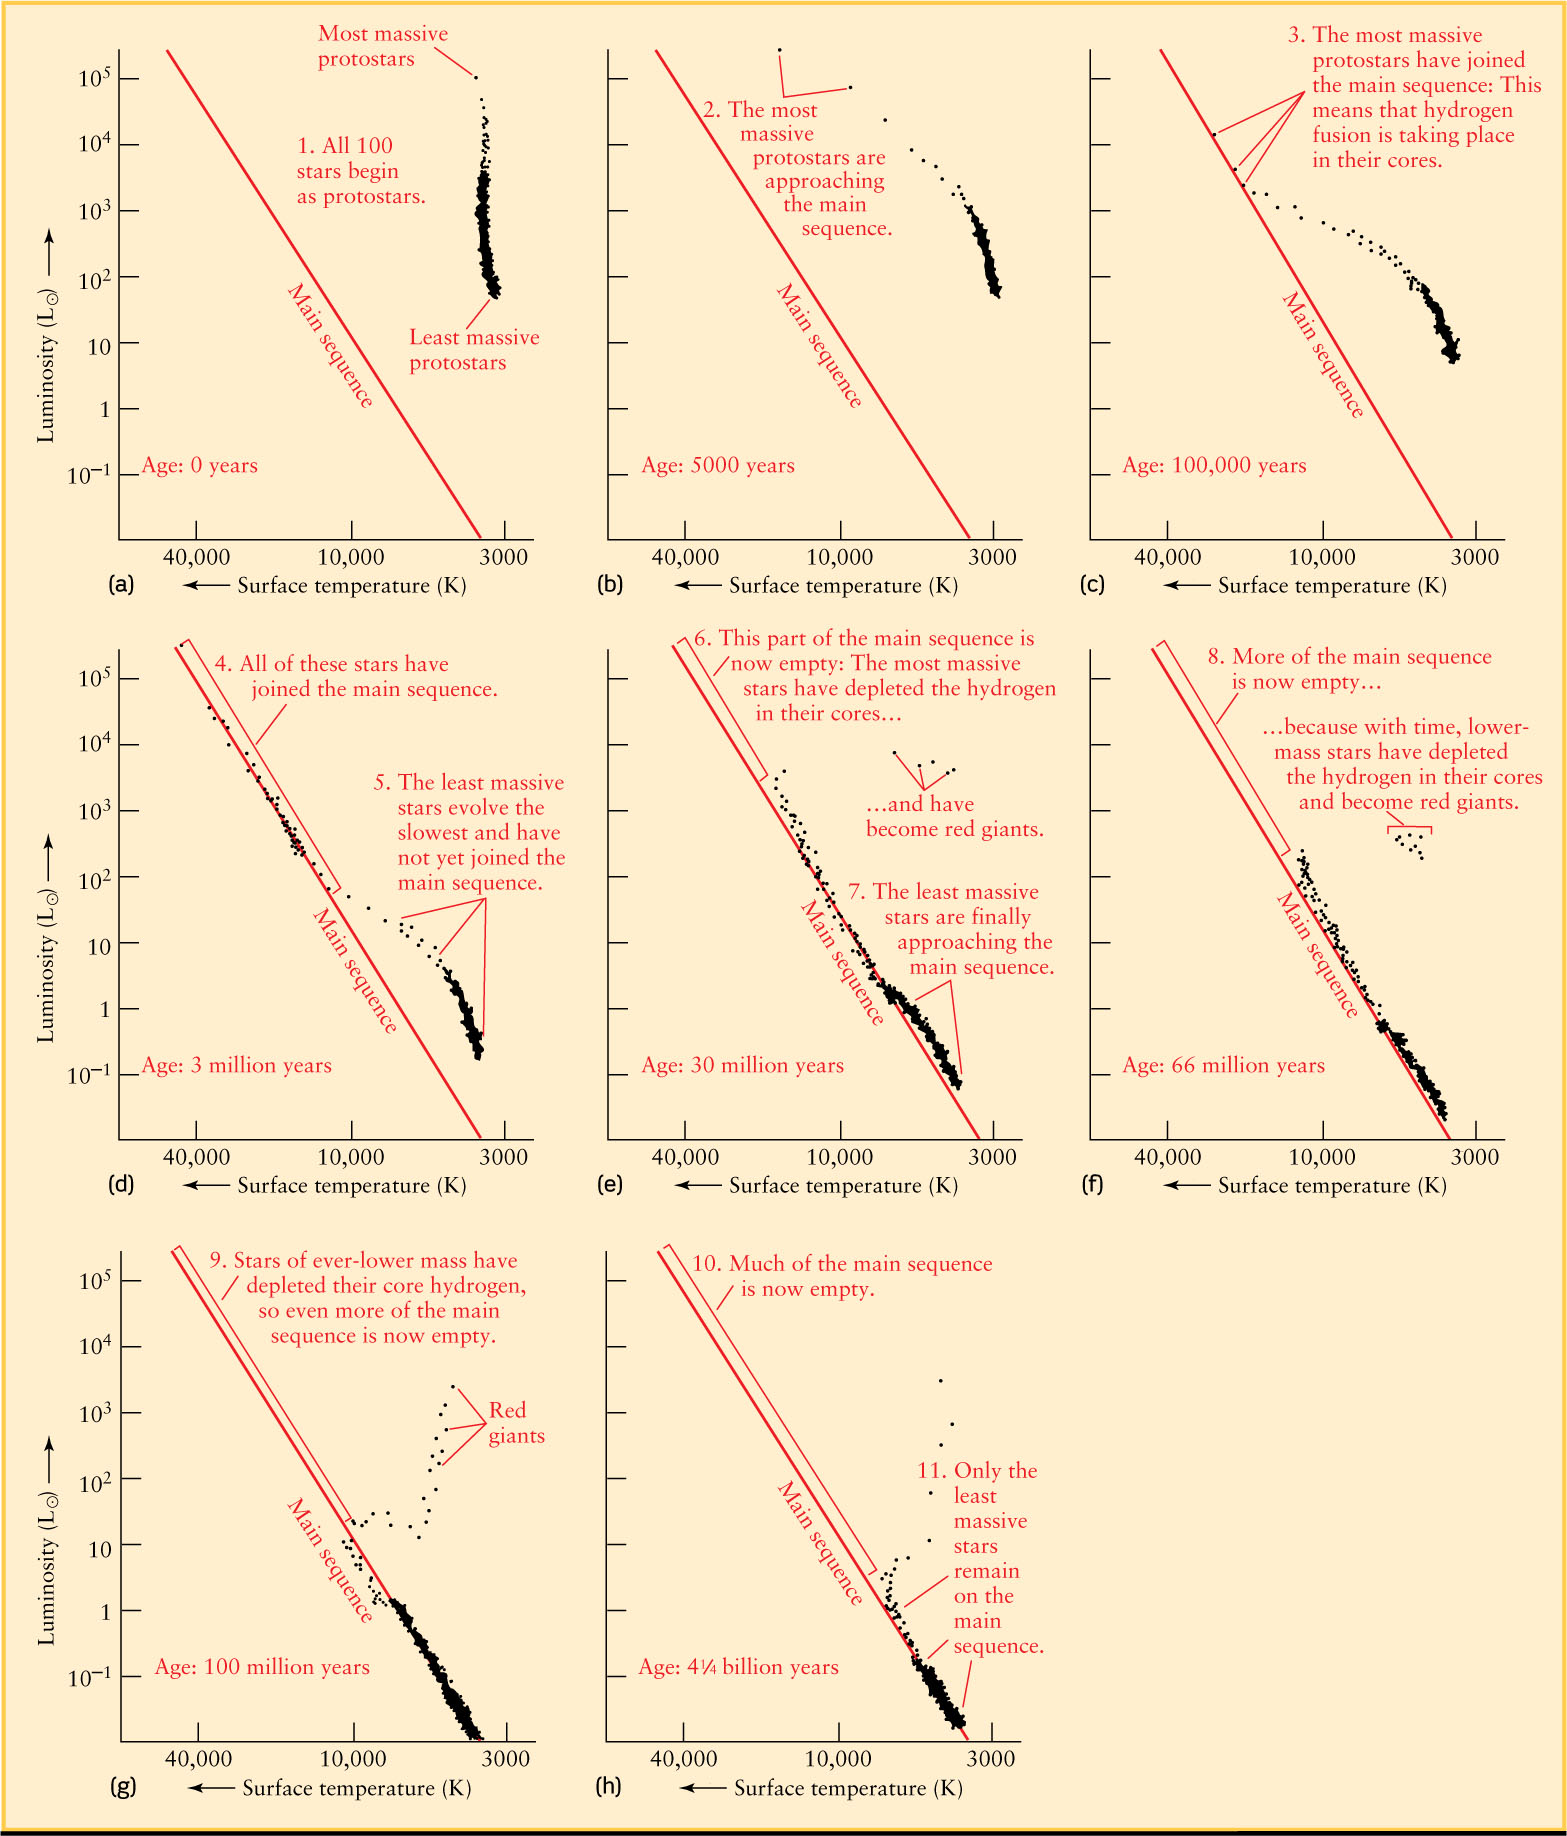
 The Evolution of a Theoretical Cluster This series of H-R diagrams shows the evolution of 100 stars of different masses in a hypothetical cluster. Each dot represents a star, and “Age” indicates the time that has elapsed since all the stars formed. At each age, the luminosity and surface temperature of each star were calculated using the equations of stellar structure. After a star passes through the red-giant stage, it is deleted from the diagram
The most massive protostars contract and heat up very rapidly. After only 5000 years, they have already moved across the H-R diagram toward the main sequence (see Figure 19-10b). After 100,000 years, these massive stars have ignited hydrogen fusion in their cores and have settled down on the main sequence as O stars (see Figure 19-10c). After 3 million years, stars of moderate mass have also ignited core hydrogen fusion and become main-sequence stars of spectral classes B and A (see Figure 19-10d). Meanwhile, low-mass protostars continue to inch their way toward the main sequence as they leisurely contract and heat up.
After 30 million years (see Figure 19-10e), the most massive stars have depleted the hydrogen in their cores and become red giants. These stars have moved from the upper left end of the main sequence to the upper right corner of the H-R diagram. (This simulation follows stars only to the red-giant stage, after which they are simply deleted from the diagram.) Intermediate-mass stars lie on the main sequence, while the lowest-mass stars are still in the protostar stage and lie above the main sequence.
After 66 million years (see Figure 19-10f), even the lowest-mass protostars have finally ignited core hydrogen fusion and have settled down on the main sequence as cool, dim, M stars. These lowest-mass stars can continue to fuse hydrogen in their cores for hundreds of billions of years.
In the final two H-R diagrams (Figure 19-10g and Figure 19-10h), the main sequence stars get “peeled” or “eaten away” from the upper left to the lower right as stars exhaust their core supplies of hydrogen and evolve into red giants. The stars that leave the main sequence between Figure 19-10g and Figure 19-10h have masses between about 1 M⊙ and 3 M⊙ and undergo the helium flash in their cores.
For all stars in this simulation, the giant stage lasts only a brief time compared to the star’s main-sequence lifetime. Compared to a 1-M⊙ star (see Figure 19-8), a more massive star has a shorter main-sequence lifetime and spends a shorter time as a giant star. Thus, at any given time, only a small fraction of the stellar population is passing through the giant stage. Hence, most of the stars we can see through telescopes are main-sequence stars. As an example, of the stars within 4.00 pc (13.05 ly) of the Sun listed in Appendix 4, only one—Procyon A—is presently evolving from a main-sequence star into a giant. Two other nearby stars are white dwarfs, an even later stage in stellar evolution that we will discuss in Chapter 20. (By contrast, most of the brightest stars listed in Appendix 5 are giants and supergiants. Although they make up only a small fraction of the stellar population, these stars stand out due to their extreme luminosity.)
CONCEPT CHECK 19-8
In Figure 19-10, is there an age when the most massive stars in the cluster have become red giants, yet the least massive stars are finally approaching the main sequence?
Yes. After 30 million years you can see in Figure 19-10e a few red giants just as low-mass stars are finally approaching the main sequence.
CONCEPT CHECK 19-9
Suppose you happened to observe the simulated cluster in Figure 19-10 just as its most massive stars were joining the main sequence. How old would the cluster be?
In Figure 19-10c, showing the cluster after 100,000 years, the most massive stars are just joining the main sequence.
Real Star Clusters: Cluster Ages and Turnoff Points
The evolution of the hypothetical cluster displayed in Figure 19-10 helps us interpret what we see in actual star clusters. We can observe the early stages of stellar evolution in open clusters, which typically contain a few hundred to a few thousand stars. Many open clusters are just a few million years old, so their H-R diagrams resemble Figure 19-10d, 19-10e, or 19-10f (see Section 18-6, especially Figure 18-20 and Figure 18-21).
As a cluster ages and its stars end their main-sequence lifetimes, the cluster’s color changes from blue to red
Star clusters tend to form in a very short period of time compared to how long their stars shine, which means each cluster has an age—the time since its formation. Figure 19-11 shows two open clusters of different ages. The nearer cluster, called M35, must be relatively young because it contains several dozen luminous, blue, high-mass main-sequence stars. These stars lie in the upper part of the main sequence on an H-R diagram. They have main-sequence lifetimes of only a few hundred million years, so M35 can be no older than that. Some of the most luminous stars in M35 are red or yellow in color; these are stars that ended their main-sequence lifetimes some time ago and have evolved into red giants. The H-R diagram for this cluster resembles Figure 19-10g.
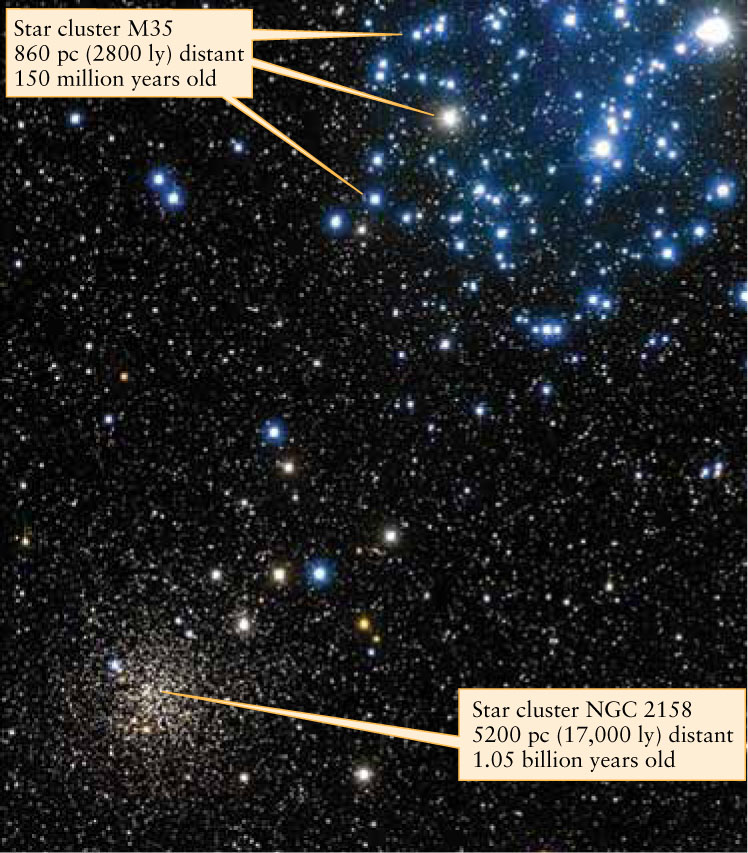
Two Open Clusters The two clusters in this image, M35 and NGC 2158, lie in almost the same direction in the constellation Gemini. The nearer cluster, M35, has a number of luminous blue main-sequence stars with surface temperatures around 10,000 K as well as a few red giants. Hence, its H-R diagram resembles that shown in Figure 19-10g, and its age is around 100 million years (more accurately, around 150 million). The more distant cluster, NGC 2158, has no blue main-sequence stars; long ago, all of these massive stars came to the end of their main-sequence lifetimes and became giants. The H-R diagram for NGC 2158 is intermediate between Figure 19-10g and Figure 19-10h, and its age (1.05 billion years) is as well.
There are no high-mass blue main-sequence stars at all in NGC 2158, the more distant cluster shown in Figure 19-11. Any such stars that were once in NGC 2158 have long since come to the end of their main-sequence lifetimes. As a result, the main sequence in this cluster has been “eaten away” more than that of M35, leaving only stars that are yellow or red in color. This tells us that NGC 2158 must be older than M35 (compare Figure 19-10g and Figure 19-10h). This example shows that as a cluster ages, it generally becomes redder in its average color.
We can see even later stages in stellar evolution by studying globular clusters, so called because of their spherical shape. A typical globular cluster contains up to 1 million stars in a volume less than 100 pc across (Figure 19-12). Among these are many highly evolved post–main-sequence stars.
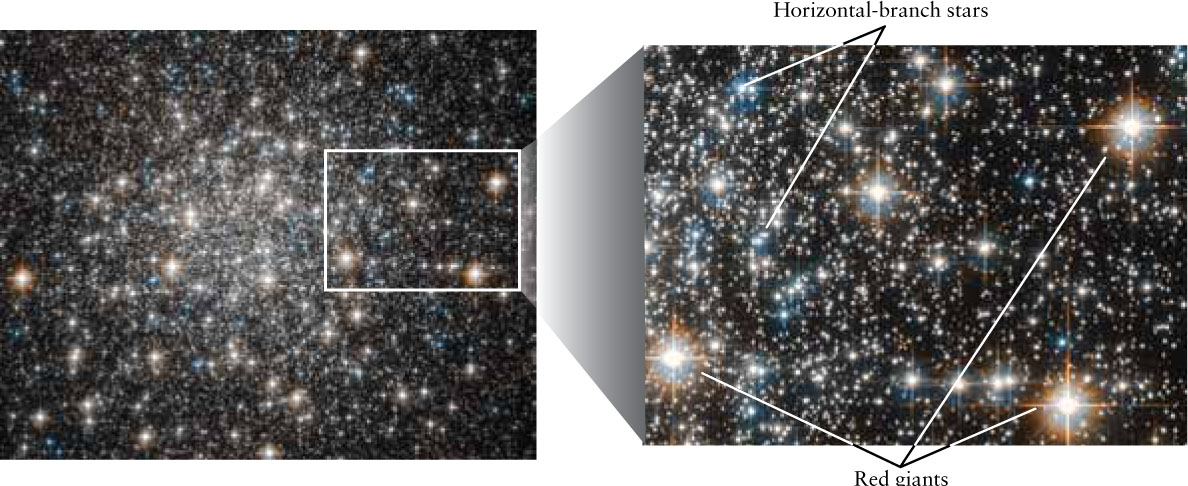
A Globular Cluster This cluster, called M10, contains a few hundred thousand stars within a diameter of only 20 pc (70 ly). It lies approximately 5000 pc (16,000 ly) from Earth in the constellation Ophiuchus (the Serpent Holder). Most of the stars in this image are either red giants or blue, horizontal-branch stars with both core helium fusion and shell hydrogen fusion.
Globular clusters must be old, because they contain no high-mass stars on the main-sequence. To determine that these clusters are old, you would measure the apparent magnitude (a measure of apparent brightness, which we introduced in Section 17-3) and color ratio of many stars in a globular cluster, then plot the data as shown in Figure 19-13. Such a color-magnitude diagram for a cluster is equivalent to an H-R diagram. The color ratio of a star tells you its surface temperature (as described in Section 17-4), and because all the stars in the cluster are at essentially the same distance from us, their relative brightnesses indicate their relative luminosities. What you would discover is that a globular cluster’s main sequence has been “peeled” or “eaten away” even more extensively than the open cluster NGC 2158 in Figure 19-11. Hence, globular clusters must be even older than NGC 2158. In a typical globular cluster, all the main-sequence stars with masses more than about 1 M⊙ or 2 M⊙ evolved long ago into red giants. Only low-mass, slowly evolving stars still have core hydrogen fusion. (Compare Figure 19-13 with Figure 19-10h.) As we will see next, not only can we tell that globular clusters are old, we can also figure out just how old they are.
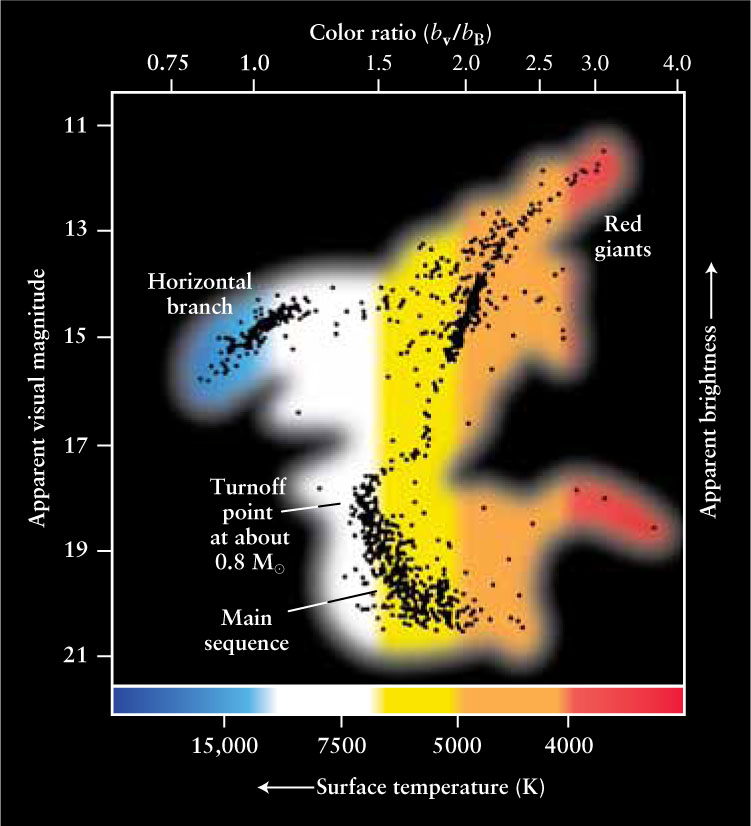
CAUTION!
The inset in Figure 19-12 shows something surprising: There are luminous blue stars in the ancient globular cluster M10. This seems to contradict our earlier statements that blue main-sequence stars evolve into red giants after just a few hundred million years. The explanation is that these are not main-sequence stars, but rather horizontal-branch stars. These stars get their name because in the color-magnitude diagram of a globular cluster, they form a horizontal grouping in the left-of-center portion of the diagram (see Figure 19-13). Horizontal-branch stars are relatively low-mass stars that have already become red giants and undergone a helium flash, so there is both core helium fusion and shell hydrogen fusion taking place in their interiors. After the helium flash their luminosity decreased to about 50 L⊙ (compared to about 1000 L⊙ before the flash) and their outer layers contracted and heated, giving these stars their blue color. In years to come, these stars will move back toward the red-giant region as their fuel is devoured. Our own Sun will go through a horizontal-branch phase in the distant future; this is the phase labeled by the number 3 at the far right of Figure 19-8.
Measuring the Ages of Star Clusters
The idea that a cluster’s main sequence is progressively “eaten away” is the key to determining the age of a cluster. In the H-R diagram for a very young cluster, all the stars are on or near the main sequence. (An example is the open cluster NGC 2264, shown in Figure 18-20.) As a cluster gets older, however, stars begin to leave the main sequence. The high-mass, high-luminosity stars are the first to consume their core hydrogen and become red giants. As time passes, fewer and fewer stars remain on the main sequence (see parts d through h of Figure 19-10).
The age of a cluster can be found from the turnoff point, which is at the peak of the surviving portion of the main-sequence stars on the cluster’s H-R diagram (see Figure 19-13). The stars at the turnoff point are just at the stage of exhausting the hydrogen in their cores, so their main-sequence lifetime is equal to the age of the cluster. Since we know the main-sequence lifetimes of stars with differing masses through modeling, we are able to determine how long ago the cluster formed. For example, in the case of the globular cluster M55 plotted in Figure 19-13, 0.8-M⊙ stars have just left the main sequence, indicating that the cluster’s age is more than 12 billion (1.2 × 10¹⁰) years (see Table 19-1).
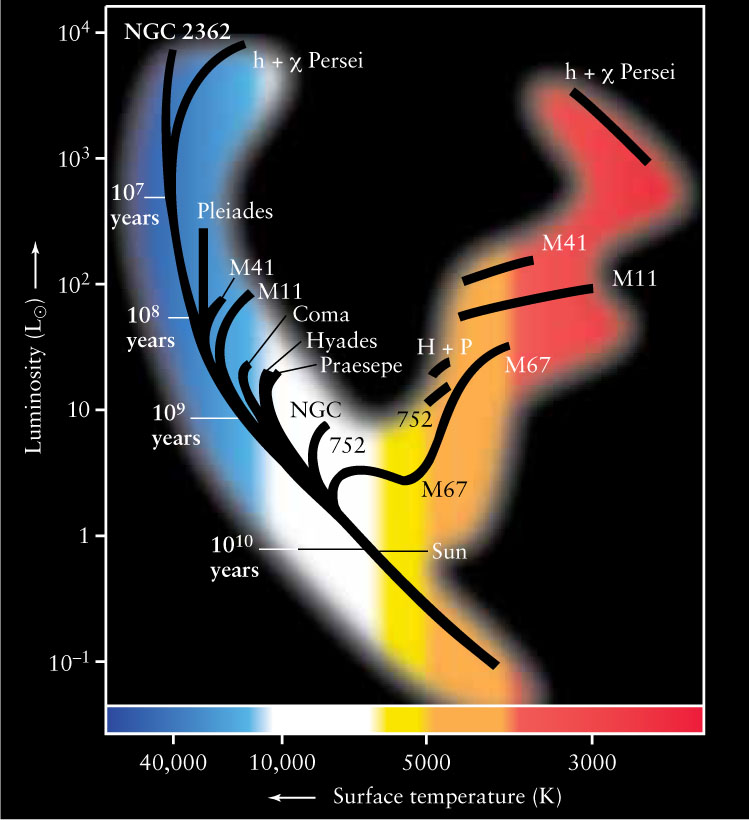
Figure 19-14 shows data for several star clusters plotted on a single H-R diagram. This graph also shows turnoff-point times from which the ages of the clusters can be estimated. Notice that the lower down the turnoff point occurs (which corresponds to lower masses moving off the main sequence), the older the cluster.
ANALOGY
Suppose you knew that certain birthday candles took 10 minutes to burn down. If you walked into a room and saw that these candles were burned halfway down on a birthday cake, you would know they were lit 5 minutes ago. In this analogy, knowing the rate that the candle burns is analogous to knowing how long a star of a given mass will remain on the main sequence.
CONCEPT CHECK 19-10
The turnoff point in Figure 19-13 corresponds to main-sequence stars that are about 7500 K. Suppose that the turnoff point was instead for stars of around 10,000 K. For a 10,000-K turnoff point, would the cluster be younger or older than 12 billion years?
The turnoff point in Figure 19-13 corresponds to 0.8-M⊙ stars that stay on the main sequence for about 12 billion years. If the turnoff point were instead at around 10,000 K, these stars would be more massive and spend less time on the main sequence, and the cluster would be younger.
CONCEPT CHECK 19-11
Using Figure 19-14, explain why turnoff points at lower luminosities correspond to older clusters.
Recall that lower-mass stars are less luminous. Therefore, the lower the luminosity of the turnoff point, the lower the mass of the main-sequence star at the turnoff point. Lower-mass stars remain on the main sequence longer, indicating an older cluster when these stars finally leave the main sequence.