19-6 Many mature stars pulsate
 We saw in Section 16-3 that the surface of our Sun vibrates in and out, although by only a small amount. But other stars undergo substantial changes in size, alternately swelling and shrinking. As these stars pulsate, their surface temperatures also vary. As a result, pulsating stars can vary dramatically in brightness. We now understand that these pulsating variable stars are actually evolved, post–main-sequence stars.
Long-Period Variables
Pulsating variable stars were first discovered in 1595 by David Fabricius, a Dutch minister and amateur astronomer. He noticed that the star ο (omicron) Ceti is sometimes bright enough to be easily seen with the naked eye but at other times fades to invisibility (Figure 19-16). By 1660, astronomers realized that these brightness variations repeated with a period of 332 days. Seventeenth-century astronomers were so enthralled by this variable star that they renamed it Mira (“wonderful”).
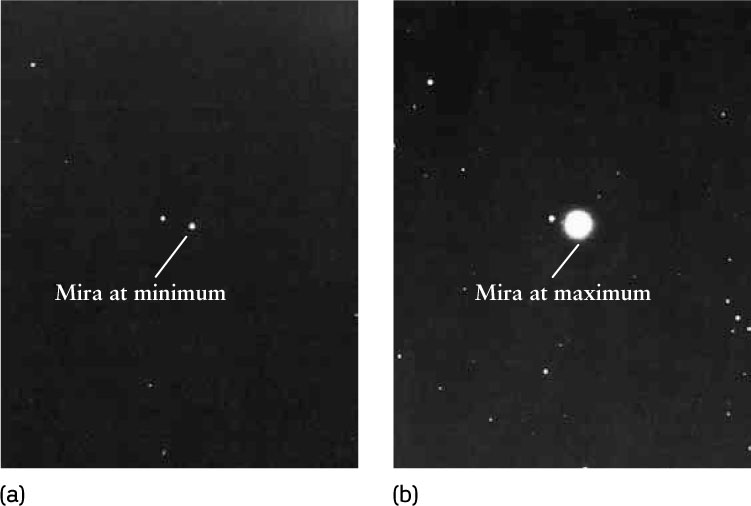
Mira—A Long-Period Variable Star Mira, or ο (omicron) Ceti, is a variable star whose luminosity varies with a 332-day period. Luminosity variations are due to changes in both surface temperature and radius. At its dimmest, as in (a) (photographed in December 1961), Mira is less than 1% as bright as when it is at maximum, as in (b) (January 1965). The physical size of the star is too small to discern with the telescope used, but variations in brightness change how wide it appears in the image.
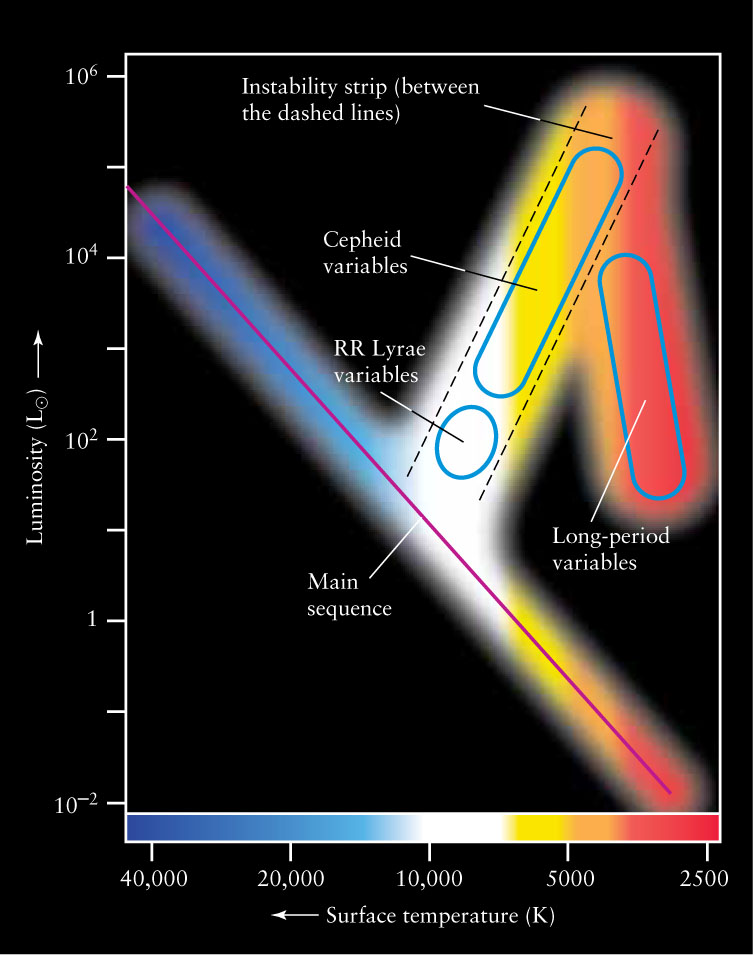
Mira is an example of a class of pulsating stars called long-period variables. These stars are cool red giants that vary in brightness by a factor of 100 or more over a period of months or years. With surface temperatures of about 3500 K and average luminosities that range from about 10 to 10,000 L⊙, they occupy the upper right side of the H-R diagram (Figure 19-17). Some, like Mira, are periodic, but others are irregular. Many eject large amounts of gas and dust into space.
Astronomers do not fully understand why some cool red giants become long-period variables. It is difficult to calculate accurate stellar models to describe such huge stars with extended, tenuous atmospheres.
Cepheid Variables
By studying variable stars, astronomers gain insight into late stages of stellar evolution
Astronomers have a much better understanding of other pulsating stars, called Cepheid variables, or simply Cepheids. As we will see, Cepheid stars play a crucial role in measuring the large-scale behavior of the universe and were some of the first objects targeted by the Hubble Space Telescope.
A Cepheid variable is recognized by the characteristic way in which its light output varies—rapid brightening followed by gradual dimming. They are named for δ (delta) Cephei, an example of this type of star discovered in 1784 by John Goodricke, a deaf, mute, 19-year-old English amateur astronomer. He found that at its most brilliant, δ Cephei is 2.3 times as bright as at its dimmest. The cycle of brightness variations repeats every 5.4 days. (Sadly, Goodricke paid for his discoveries with his life; he caught pneumonia while making his nightly observations and died before his twenty-second birthday.) The surface temperatures and luminosities of the Cepheid variables place them in the upper middle of the H-R diagram (see Figure 19-17).
After core helium fusion begins, mature stars move across the middle of the H-R diagram. Figure 19-9a shows the evolutionary tracks of high-mass stars crisscrossing the H-R diagram. Post–helium-flash stars of moderate mass also cross the middle of the H-R diagram between the red-giant region and the horizontal branch.
During these transitions across the H-R diagram, a star can become unstable and pulsate. In fact, there is a region on the H-R diagram between the upper main sequence and the red-giant branch called the instability strip (see Figure 19-17). When an evolving star passes through this region, the star pulsates and its brightness varies periodically. Figure 19-18a shows the brightness variations of δ Cephei, which lies within the instability strip.
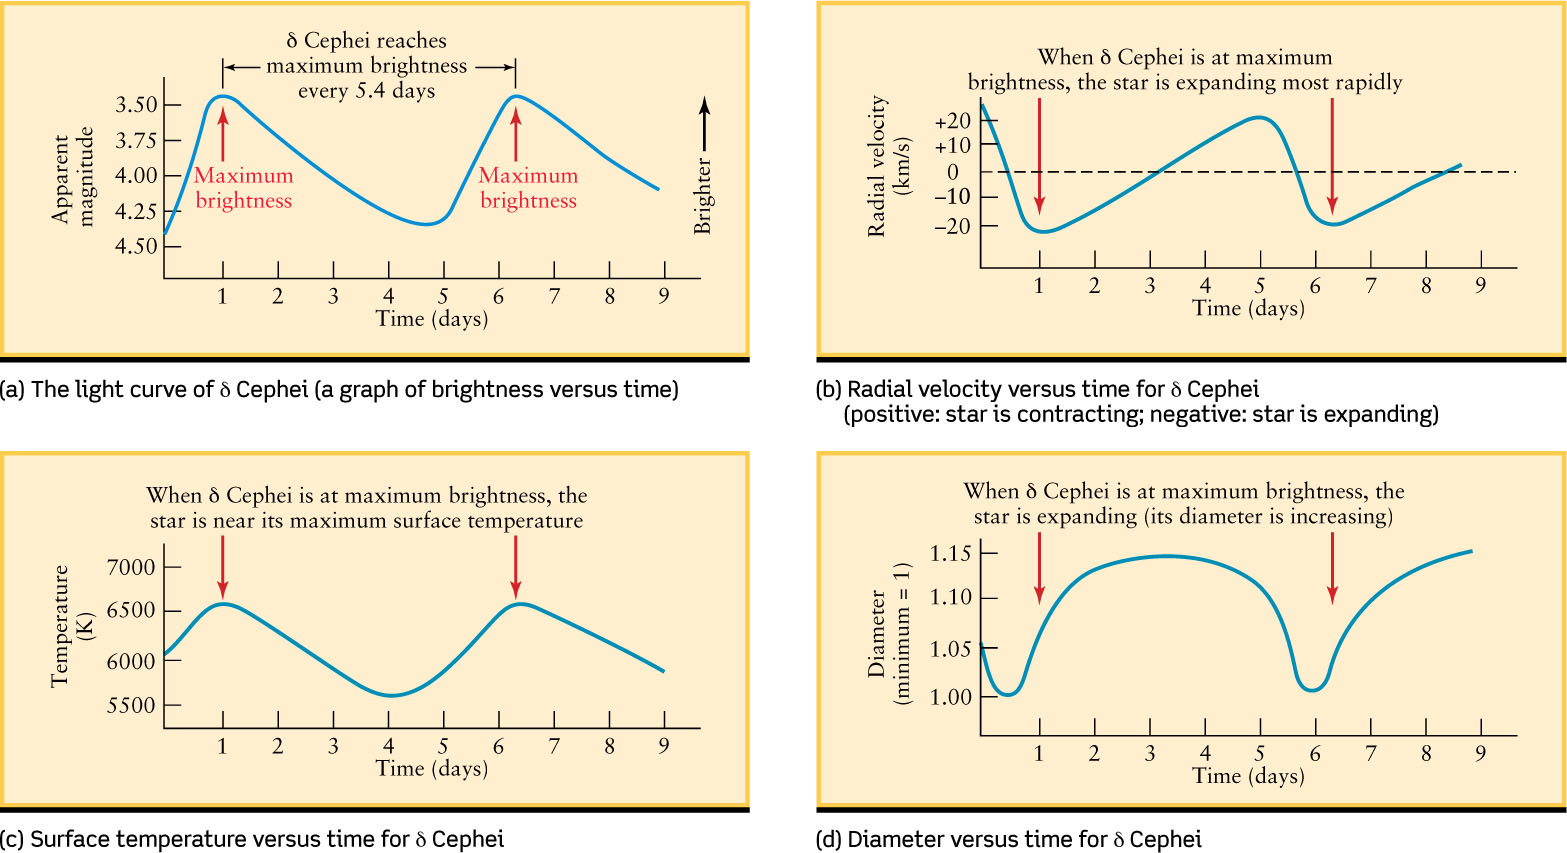
A Cepheid variable brightens and fades because the star’s outer envelope cyclically expands and contracts. The first to observe this was the Russian astronomer Aristarkh Belopolsky, who noticed in 1894 that spectral lines in the spectrum of δ Cephei shift back and forth with the same 5.4-day period as that of the magnitude variations. From the Doppler effect, we can translate these wavelength shifts into radial velocities and draw a velocity curve (Figure 19-18b). Negative velocities mean that the star’s surface is expanding toward us; positive velocities mean that the star’s surface is receding. Note that the light curve and velocity curve are mirror images of each other. The star is brighter than average while it is expanding and dimmer than average while contracting.
When a Cepheid variable pulsates, the star’s surface oscillates up and down like a spring. During these cyclical expansions and contractions, the star’s gases alternately heat up and cool down. Figure 19-18c shows the resulting changes in the star’s surface temperature. Figure 19-18d graphs the periodic changes in the star’s diameter.
Just as a bouncing ball eventually comes to rest, a pulsating star would soon stop pulsating without something to keep its oscillations going. In 1914, the British astronomer Arthur Eddington suggested that a Cepheid pulsates because the star is more opaque when compressed than when expanded. When the star is compressed, trapped heat increases the internal pressure, which pushes the star’s surface outward. When the star expands, the heat escapes, the internal pressure drops, and the star’s surface falls inward. This process is analogous to a boiling pot with a lid that lifts on and off the pot as the pressure varies (Figure 19-19).
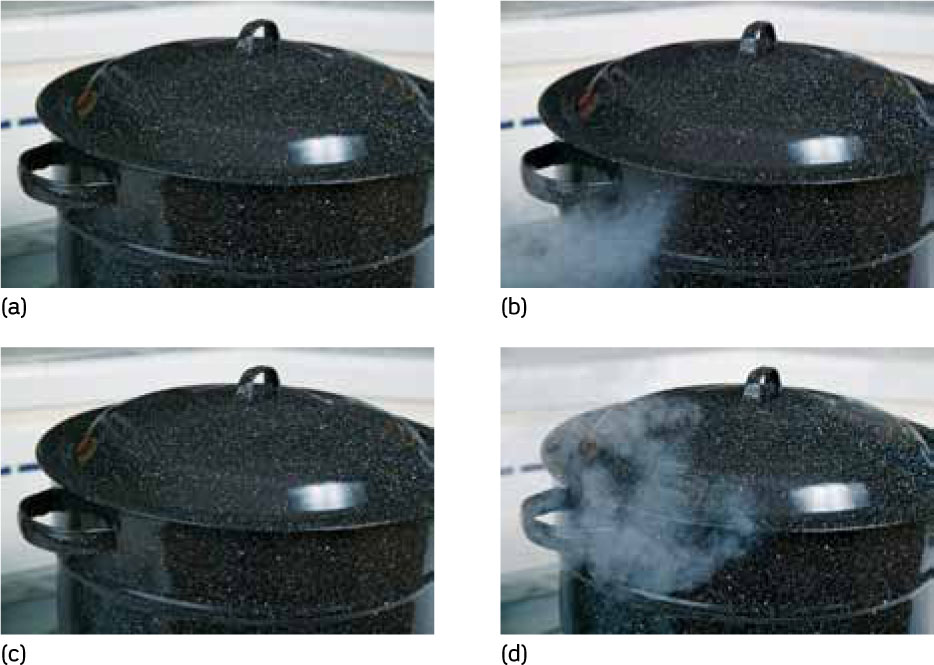
Analogy for Cepheid Variability (a) As pressure builds up in this pot, the force on the lid (analogous to a Cepheid’s outer layers) increases. (b) When the pressure inside the pot is sufficient, it lifts the lid off (expands the star’s outer layers) and thereby allows some of the energy inside to escape. This process goes through cycles (two are shown), as do the luminosity and temperature of Cepheid stars.
In the 1960s, the American astronomer John Cox followed up on Eddington’s idea and proved that helium is what keeps Cepheids pulsating. Normally, when a star’s helium is compressed, the gas increases in temperature and becomes more transparent. But in certain layers near the star’s surface, compression may ionize helium (remove one of its electrons) instead of raising its temperature. Ionized helium gas is quite opaque, so these layers effectively trap heat and make the star expand, as Eddington suggested. This expansion cools the outer layers and makes the helium ions recombine with electrons, which makes the gas more transparent and releases the trapped energy. The star’s surface then falls inward, recompressing the helium, and the cycle begins all over again.
CAUTION!
In our discussion of the behavior of gases (see Box 19-1, Section 19-1, and Section 19-3) we saw that a gas cools when it expands and heats up when it is compressed. Hence, you would expect that the gases in a pulsating star like δ Cephei would reach their maximum temperature when the star is at its smallest diameter, so that the gases are most compressed. The hotter the gas, the more brightly it glows, so δ Cephei should also have its maximum brightness when its diameter is smallest. But Figure 19-18 shows that the star’s brightness and the temperature of the gases at the surface reach their maximum values when the star is expanding, some time after the star has contracted to its smallest diameter. How can this be? The explanation is again related to how opaque the gases are inside the star. The rate at which energy is emitted from the central regions of the star is indeed greatest when the star is at its minimum diameter, but the opaque gases in the star’s outer layers impede the flow of energy to the surface. Hence, δ Cephei reaches its maximum brightness and maximum surface temperature about half a day after the star is at its smallest size.
CONCEPT CHECK 19-13
What accounts for most of the brightening of a Cepheid variable: an increase in temperature, or an increase in size? (Consult Figure 19-18.)
You can see that the Cepheid in Figure 19-18a peaks in luminosity on day 1. This is about when the temperature peaks as well in Figure 19-18c. However, when the star reaches its maximum size in Figure 19-18d, the luminosity is already declining. Therefore, surface temperature contributes more to the peak luminosity.
Determining the Distance of a Cepheid
Cepheid variables are important because they allow astronomers to determine the distances to these stars. This method works so well that it can even be used to measure the distances to other galaxies containing Cepheids. Why is this so important? As we will see in Chapter 23, mapping out distances to other galaxies has lead to profound discoveries about the very structure and nature of the universe.
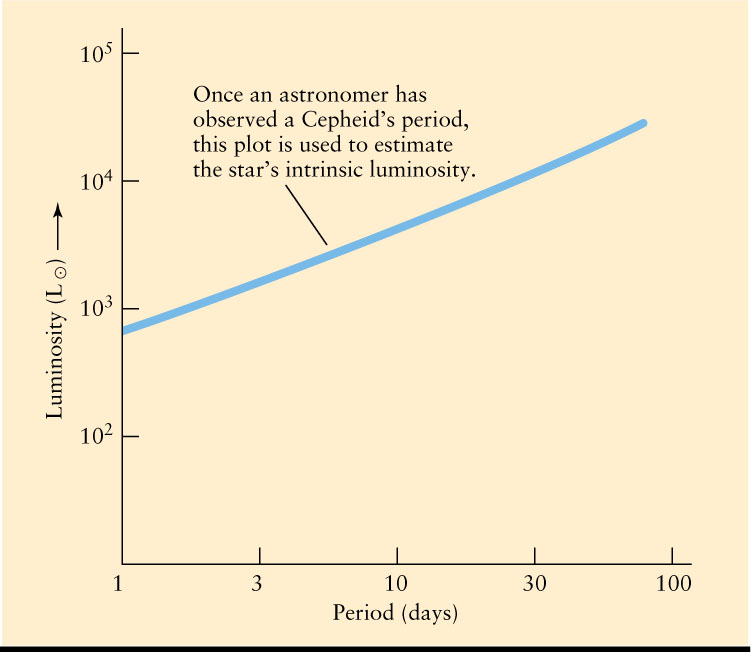
Determining the distance to a Cepheid is based on two properties. First, Cepheids can be seen even at distances of millions of parsecs, because they are very luminous, ranging from a few hundred times solar luminosity to more than 104 L⊙. Second, there is a direct relationship between a Cepheid’s period and its average luminosity: The dimmest Cepheid variables pulsate rapidly, with periods of 1 to 2 days, while the most luminous Cepheids pulsate with much slower periods of about 100 days.
Figure 19-20 shows this period-luminosity relation, discovered by the American astronomer Henrietta Swan Leavitt, a “computer” at the observatory at Harvard College. Harvard did not let women use its telescope in the early 1900s, but in 1912 Leavitt analyzed photographic plates containing thousands of nearby Cepheids to establish a relationship between their period and luminosity. By first measuring the period of a distant Cepheid’s brightness variations, and then using a graph like Figure 19-20, an astronomer can determine the star’s intrinsic luminosity. By also measuring the star’s apparent brightness, the distance to the Cepheid can then be found by using the inverse-square law (see Section 17-2). By applying the period-luminosity relation in this way to Cepheids in other galaxies, astronomers have been able to calculate the distances to those galaxies with great accuracy. (Box 17-2 gives an example of such a calculation.) As we will see in Chapters 23 and 25, such measurements play an important role in determining the overall size and structure of the universe.
The evolutionary tracks of mature, high-mass stars pass back and forth through the upper end of the instability strip on the H-R diagram. These stars become Cepheids when helium ionization occurs at just the right depth to drive the pulsations. For stars on the high-temperature (left) side of the instability strip, helium ionization occurs too close to the surface and involves only an insignificant fraction of the star’s mass. For stars on the cool (right) side of the instability strip, convection in the star’s outer layers prevents the storage of the energy needed to drive the pulsations. Thus, Cepheids exist only in a narrow temperature range on the H-R diagram.
RR Lyrae Variables
Stars of lower mass do not become Cepheids. Instead, after leaving the main sequence, becoming red giants, and undergoing the helium flash, their evolutionary tracks pass through the lower end of the instability strip as they move along the horizontal branch. Some of these stars become RR Lyrae variables, named for their prototype in the constellation Lyra (the Harp). RR Lyrae variables all have periods shorter than one day and roughly the same average luminosity as horizontal-branch stars, about 100 L⊙. In fact, the RR Lyrae region of the instability strip (see Figure 19-17) is actually a segment of the horizontal branch. RR Lyrae stars are all metal-poor, Population II stars. Many have been found in globular clusters, and they have been used to determine the distances to those clusters in the same way that Cepheids are used to find the distances to other galaxies. In Chapter 22 we will see how RR Lyrae stars helped astronomers determine the size of the Milky Way Galaxy.
In some cases the expansion speed of a pulsating star exceeds the star’s escape speed. When this happens, the star’s outer layers are ejected completely. We will see in Chapter 20 that dying stars eject significant amounts of mass in this way, renewing and enriching the interstellar medium for future generations of stars.
CONCEPT CHECK 19-14
If a Cepheid variable star was observed to vary in brightness with a period of 30 days, how would you use Figure 19-20 to determine the distance to this star?
Figure 19-20 indicates that a variable star with a 30-day period has an intrinsic luminosity (L) about 10,000 times brighter than our Sun. Direct observations of the star also tell you its apparent brightness (b). Section 17-2 describes how these two quantities are directly related to the distance (d) of the star, so the distance is easily determined.