12.4
Proteins Carry Out Most Membrane Processes
We now turn to membrane proteins, which are responsible for most of the dynamic processes carried out by membranes. Membrane lipids form a permeability barrier and thereby establish compartments, whereas specific proteins mediate nearly all other membrane functions. In particular, proteins transport chemicals and information across a membrane. Membrane lipids create the appropriate environment for the action of such proteins.
Membranes differ in their protein content. Myelin, a membrane that serves as an electrical insulator around certain nerve fibers, has a low content of protein (18%). Relatively pure lipids are well suited for insulation. In contrast, the plasma membranes, or exterior membranes, of most other cells are much more metabolically active. They contain many pumps, channels, receptors, and enzymes. The protein content of these plasma membranes is typically 50%. Energy-transduction membranes, such as the internal membranes of mitochondria and chloroplasts, have the highest content of protein, around 75%.
The protein components of a membrane can be readily visualized by SDS–polyacrylamide gel electrophoresis. As stated earlier, the electrophoretic mobility of many proteins in SDS-containing gels depends on the mass rather than on the net charge of the protein. The gel-electrophoresis patterns of three membranes—the plasma membrane of erythrocytes, the photoreceptor membrane of retinal rod cells, and the sarcoplasmic reticulum membrane of muscle—are shown in Figure 12.15. It is evident that each of these three membranes contains many proteins but has a distinct protein composition. In general, membranes performing different functions contain different repertoires of proteins.
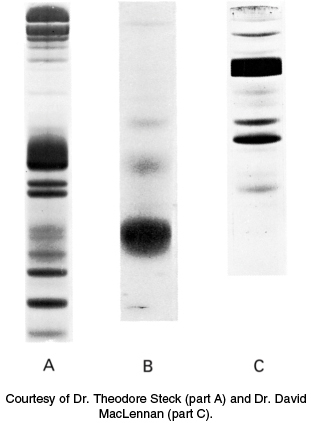
FIGURE 12.15SDS–acrylamide gel patterns of membrane proteins. (A) The plasma membrane of erythrocytes. (B) The photoreceptor membranes of retinal rod cells. (C) The sarcoplasmic reticulum membrane of muscle cells.
[Courtesy of Dr. Theodore Steck (part A) and Dr. David MacLennan (part C).]
Proteins associate with the lipid bilayer in a variety of ways
The ease with which a protein can be dissociated from a membrane indicates how intimately it is associated with the membrane. Some membrane proteins can be solubilized by relatively mild means, such as extraction by a solution of high ionic strength (e.g., 1 M NaCl). Other membrane proteins are bound much more tenaciously; they can be solubilized only by using a detergent or an organic solvent. Membrane proteins can be classified as being either peripheral or integral on the basis of this difference in dissociability (Figure 12.16). Integral membrane proteins interact extensively with the hydrocarbon chains of membrane lipids, and they can be released only by agents that compete for these nonpolar interactions. In fact, most integral membrane proteins span the lipid bilayer. In contrast, peripheral membrane proteins are bound to membranes primarily by electrostatic and hydrogen-bond interactions with the head groups of lipids. These polar interactions can be disrupted by adding salts or by changing the pH. Many peripheral membrane proteins are bound to the surfaces of integral proteins, on either the cytoplasmic or the extracellular side of the membrane. Others are anchored to the lipid bilayer by a covalently attached hydrophobic chain, such as a fatty acid.
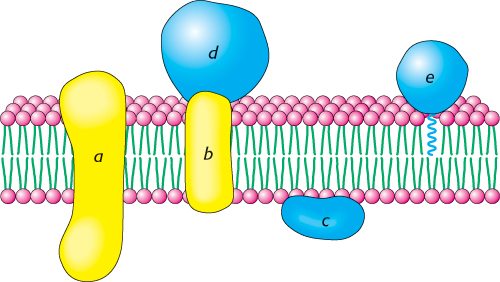
FIGURE 12.16Integral and peripheral membrane proteins. Integral membrane proteins (a and b) interact extensively with the hydrocarbon region of the bilayer. Most known integral membrane proteins traverse the lipid bilayer. Peripheral membrane proteins interact with the polar head groups of the lipids (c) or bind to the surfaces of integral proteins (d). Other proteins are tightly anchored to the membrane by a covalently attached lipid molecule (e).
Proteins can span the membrane with alpha helices.
The first membrane protein that we consider is the archaeal protein bacteriorhodopsin, shown in Figure 12.17. This protein uses light energy to transport protons from inside to outside the cell, generating a proton gradient used to form ATP. Bacteriorhodopsin is built almost entirely of α helices; seven closely packed α helices, nearly perpendicular to the plane of the cell membrane, span its 45-Å width. Examination of the primary structure of bacteriorhodopsin reveals that most of the amino acids in these membrane-spanning α helices are nonpolar and only a very few are charged (Figure 12.18). This distribution of nonpolar amino acids is sensible because these residues are either in contact with the hydrocarbon core of the membrane or with one another. Membrane-spanning α helices are the most common structural motif in membrane proteins. As will be considered in Section 12.5, such regions can often be detected by examining amino acid sequence alone.
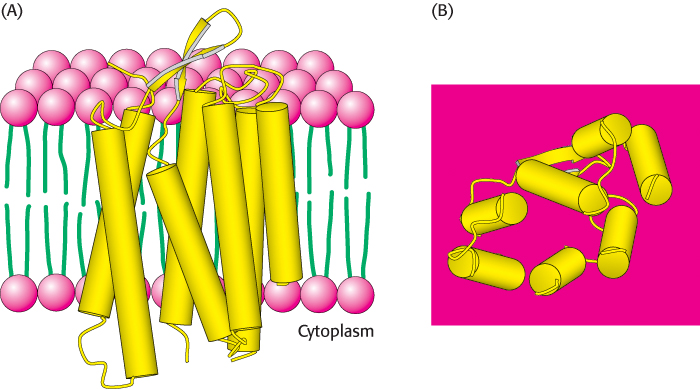
 FIGURE 12.17 Structure of bacteriorhodopsin. Notice that bacteriorhodopsin consists largely of membrane-spanning α helices (represented by yellow cylinders). (A) View through the membrane bilayer. The interior of the membrane is green and the head groups are red. (B) View from the cytoplasmic side of the membrane.
[Drawn from 1BRX.pdb.]
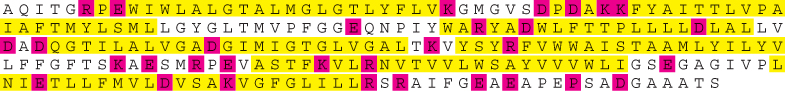
FIGURE 12.18Amino acid sequence of bacteriorhodopsin. The seven helical regions are highlighted in yellow and the charged residues in red.
A channel protein can be formed from beta strands.
Porin, a protein from the outer membranes of bacteria such as E. coli and Rhodobacter capsulatus, represents a class of membrane proteins with a completely different type of structure. Structures of this type are built from β strands and contain essentially no α helices (Figure 12.19).
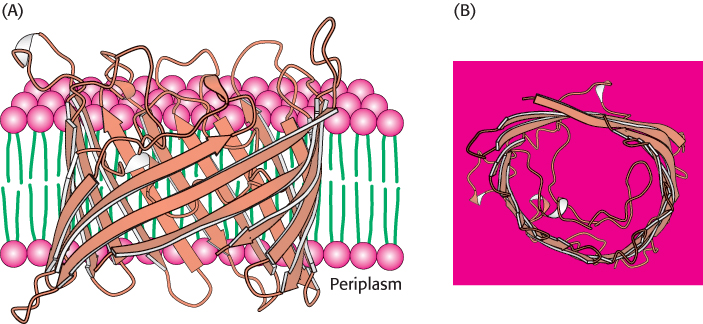
FIGURE 12.19 Structure of bacterial porin (from Rhodopseudomonas blastica). Notice that this membrane protein is built entirely of β strands. (A) Side view. (B) View from the periplasmic space. Only one monomer of the trimeric protein is shown.
[Drawn from 1PRN.pdb.]
The arrangement of β strands is quite simple: each strand is hydrogen bonded to its neighbor in an antiparallel arrangement, forming a single β sheet. The β sheet curls up to form a hollow cylinder that, as its name suggests, forms a pore, or channel, in the membrane. The outside surface of porin is appropriately nonpolar, given that it interacts with the hydrocarbon core of the membrane. In contrast, the inside of the channel is quite hydrophilic and is filled with water. This arrangement of nonpolar and polar surfaces is accomplished by the alternation of hydrophobic and hydrophilic amino acids along each β strand (Figure 12.20).
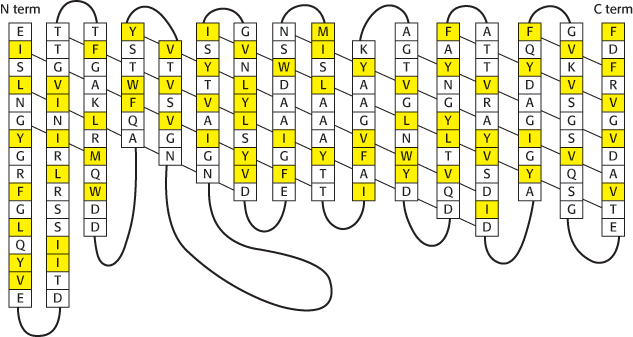
FIGURE 12.20Amino acid sequence of a porin. Some membrane proteins, such as porins, are built from β strands that tend to have hydrophobic and hydrophilic amino acids in adjacent positions. The secondary structure of porin from Rhodopseudomonas blastica is shown, with the diagonal lines indicating the direction of hydrogen bonding along the β sheet. Hydrophobic residues (F, I, L, M, V, W, and Y) are shown in yellow. These residues tend to lie on the outside of the structure, in contact with the hydrophobic core of the membrane.
Embedding part of a protein in a membrane can link the protein to the membrane surface.
The structure of the endoplasmic reticulum membrane-bound enzyme prostaglandin H2 synthase-1 reveals a rather different role for α helices in protein–membrane associations. This enzyme catalyzes the conversion of arachidonic acid into prostaglandin H2 in two steps: (1) a cyclooxygenase reaction and (2) a peroxidase reaction (Figure 12.21). Prostaglandin H2 promotes inflammation and modulates gastric acid secretion. The enzyme that produces prostaglandin H2 is a homodimer with a rather complicated structure consisting primarily of α helices. Unlike bacteriorhodopsin, this protein is not largely embedded in the membrane. Instead, it lies along the outer surface of the membrane, firmly bound by a set of α helices with hydrophobic surfaces that extend from the bottom of the protein into the membrane (Figure 12.22). This linkage is sufficiently strong that only the action of detergents can release the protein from the membrane. Thus, this enzyme is classified as an integral membrane protein, although it does not span the membrane.
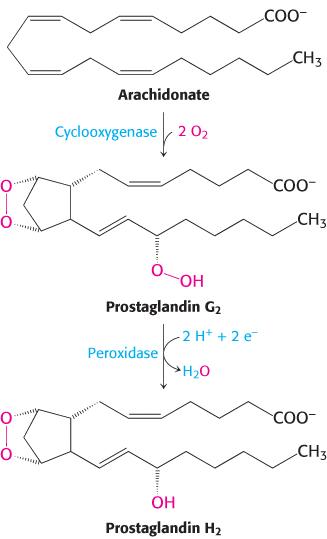
FIGURE 12.21Formation of prostaglandin H2. Prostaglandin H2 synthase-1 catalyzes the formation of prostaglandin H2 from arachidonic acid in two steps.
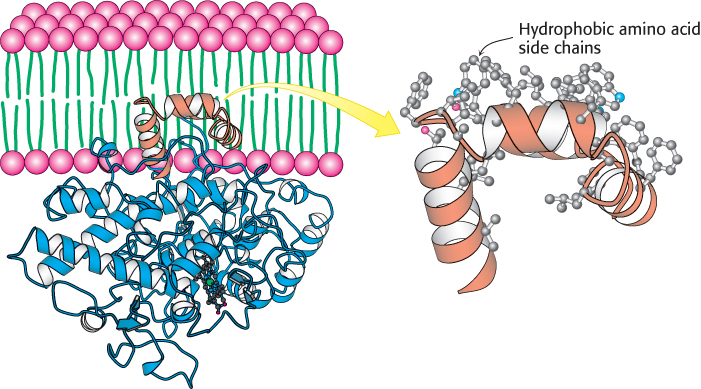
FIGURE 12.22Attachment of prostaglandin H2 synthase-1 to the membrane. Notice that prostaglandin H2 synthase-1 is held in the membrane by a set of α helices (orange) coated with hydrophobic side chains. One monomer of the dimeric enzyme is shown.
[Drawn from 1PTH.pdb.]
 The localization of prostaglandin H2 synthase-l in the membrane is crucial to its function. The substrate for this enzyme, arachidonic acid, is a hydrophobic molecule generated by the hydrolysis of membrane lipids. Arachidonic acid reaches the active site of the enzyme from the membrane without entering an aqueous environment by traveling through a hydrophobic channel in the protein (Figure 12.23). Indeed, nearly all of us have experienced the importance of this channel: drugs such as aspirin and ibuprofen block the channel and prevent prostaglandin synthesis by inhibiting the cyclooxygenase activity of the synthase. In particular, aspirin acts through the transfer of its acetyl group to a serine residue (Ser 530) that lies along the path to the active site (Figure 12.24).
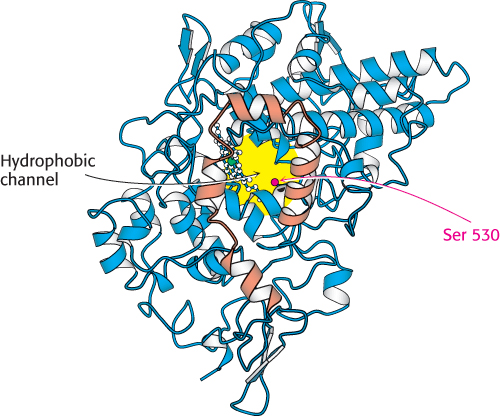
FIGURE 12.23 Hydrophobic channel of prostaglandin H2 synthase-1. A view of prostaglandin H2 synthase-1 from the membrane shows the hydrophobic channel that leads to the active site. The membrane-anchoring helices are shown in orange.
[Drawn from 1PTH.pdb.]

FIGURE 12.24Aspirin’s effects on prostaglandin H2 synthase-1. Aspirin acts by transferring an acetyl group to a serine residue in prostaglandin H2 synthase-1.
Two important features emerge from our examination of these three examples of membrane-protein structure. First, the parts of the protein that interact with the hydrophobic parts of the membrane are coated with nonpolar amino acid side chains, whereas those parts that interact with the aqueous environment are much more hydrophilic. Second, the structures positioned within the membrane are quite regular and, in particular, all backbone hydrogen-bond donors and acceptors participate in hydrogen bonds. Breaking a hydrogen bond within a membrane is quite unfavorable, because little or no water is present to compete for the polar groups.
Some proteins associate with membranes through covalently attached hydrophobic groups
The membrane proteins considered thus far associate with the membrane through surfaces generated by hydrophobic amino acid side chains. However, even otherwise soluble proteins can associate with membranes if hydrophobic groups are attached to the proteins. Three such groups are shown in Figure 12.25: (1) a palmitoyl group attached to a specific cysteine residue by a thioester bond, (2) a farnesyl group attached to a cysteine residue at the carboxyl terminus, and (3) a glycolipid structure termed a glycosylphosphatidylinositol (GPI) anchor attached to the carboxyl terminus. These modifications are attached by enzyme systems that recognize specific signal sequences near the site of attachment.
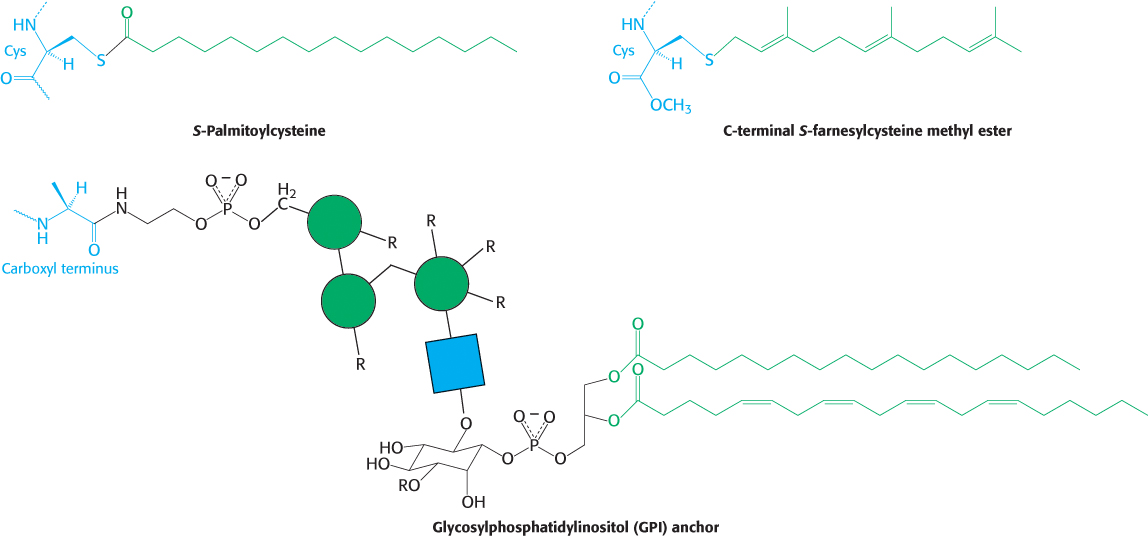
FIGURE 12.25Membrane anchors. Membrane anchors are hydrophobic groups that are covalently attached to proteins (in blue) and tether the proteins to the membrane. The green circles and blue square correspond to mannose and β-d-acetylglucosamine (GlcNAc), respectively. R groups represent points of additional modification.
Transmembrane helices can be accurately predicted from amino acid sequences
TABLE 12.2 Polarity scale for identifying transmembrane helices
|
|
Transfer free energy in kJ mol−1 (kcal mol−1) |
|
|
|
|
|
|
|
|
|
|
|
|
|
|
|
|
|
|
|
|
|
|
|
|
|
|
|
|
|
|
|
|
|
|
|
|
|
|
|
|
|
|
|
|
|
|
|
|
|
|
|
|
|
|
|
|
|
|
|
|
Source: Data from D. M. Engelman, T. A. Steitz, and A. Goldman. Annu. Rev. Biophys. Biophys. Chem. 15(1986):321–353. |
Note: The free energies are for the transfer of an amino acid residue in an α helix from the membrane interior (assumed to have a dielectric constant of 2) to water. |
Many membrane proteins, like bacteriorhodopsin, employ α helices to span the hydrophobic part of a membrane. As noted earlier, most of the residues in these α helices are nonpolar and almost none of them are charged. Can we use this information to identify likely membrane-spanning regions from sequence data alone? One approach to identifying transmembrane helices is to ask whether a postulated helical segment is likely to be more stable in a hydrocarbon environment or in water. Specifically, we want to estimate the free-energy change when a helical segment is transferred from the interior of a membrane to water. Free-energy changes for the transfer of individual amino acid residues from a hydrophobic to an aqueous environment are given in Table 12.2. For example, the transfer of a helix formed entirely of l-arginine residues, a positively charged amino acid, from the interior of a membrane to water would be highly favorable [− 51.5 kJ mol−1 (−12.3 kcal mol−1) per arginine residue in the helix]. In contrast, the transfer of a helix formed entirely of l -phenylalanine, a hydrophobic amino acid, would be unfavorable [+15.5 kJ mol−1 (+3.7 kcal mol−1) per phenylalanine residue in the helix].
The hydrocarbon core of a membrane is typically 30 Å wide, a length that can be traversed by an α helix consisting of 20 residues. We can take the amino acid sequence of a protein and estimate the free-energy change that takes place when a hypothetical α helix formed of residues 1 through 20 is transferred from the membrane interior to water. The same calculation can be made for residues 2 through 21, 3 through 22, and so forth, until we reach the end of the sequence. The span of 20 residues chosen for this calculation is called a window. The free-energy change for each window is plotted against the first amino acid at the window to create a hydropathy plot. Empirically, a peak of + 84 kJ mol−1 (+ 20 kcal mol−1) or more in a hydropathy plot based on a window of 20 residues indicates that a polypeptide segment could be a membrane-spanning α helix. For example, glycophorin, a protein found in the membranes of red blood cells, is predicted by this criterion to have one membrane-spanning helix, in agreement with experimental findings (Figure 12.26). Note, however, that a peak in the hydropathy plot does not prove that a segment is a transmembrane helix. Even soluble proteins may have highly nonpolar regions. Conversely, some membrane proteins contain membrane-spanning features (such as a set of cylinder-forming β strands) that escape detection by these plots (Figure 12.27).
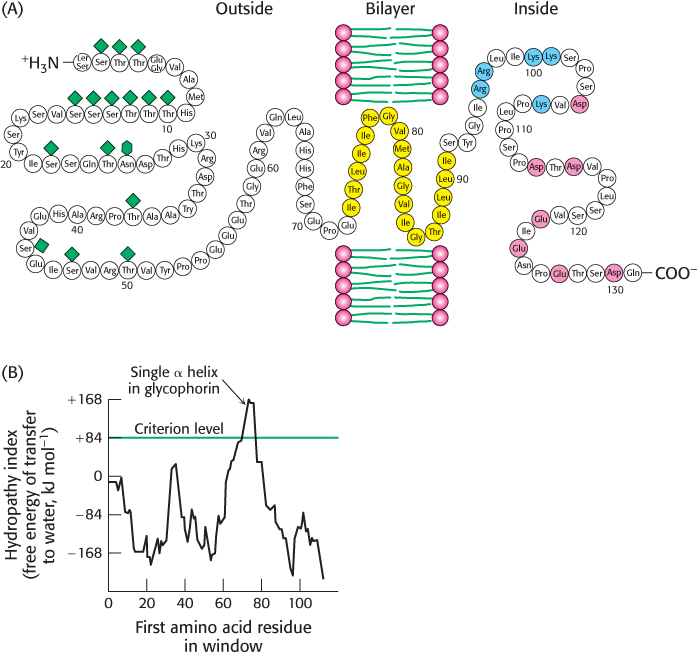
FIGURE 12.26Locating the membrane-spanning helix of glycophorin. (A) Amino acid sequence and transmembrane disposition of glycophorin A from the red-blood-cell membrane. Fifteen O-linked carbohydrate units are shown as diamond shapes, and an N-linked unit is shown as a lozenge shape. The hydrophobic residues (yellow) buried in the bilayer form a transmembrane α helix. The carboxyl-terminal part of the molecule, located on the cytoplasmic side of the membrane, is rich in negatively charged (red) and positively charged (blue) residues. (B) Hydropathy plot for glycophorin. The free energy for transferring a helix of 20 residues from the membrane to water is plotted as a function of the position of the first residue of the helix in the sequence of the protein. Peaks of greater than +84 kJ mol−1 (+20 kcal mol−1) in hydropathy plots are indicative of potential transmembrane helices.
[(A) Information from Dr. Vincent Marchesi; (B) data from D. M. Engelman, T. A. Steitz, and A. Goldman, Annu. Rev. Biophys. Biophys. Chem. 15:321–353, 1986. Copyright © 1986 by Annual Reviews, Inc. All rights reserved.]
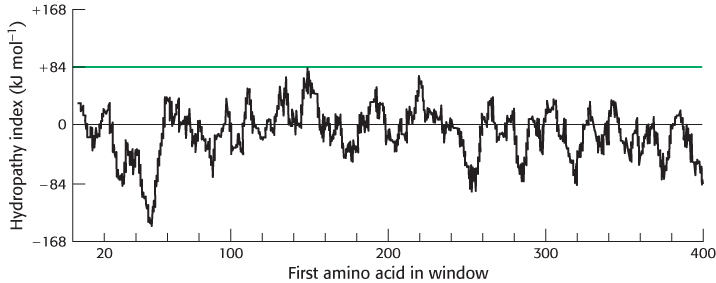
FIGURE 12.27Hydropathy plot for porin. No strong peaks are observed for this intrinsic membrane protein, because it is constructed from membrane-spanning β strands rather than α helices.