Section 10.4 Exercises
CLARIFYING THE CONCEPTS
Question 10.157
1. In the section, what is the F test used to compare? (p. 617)
10.4.1
Two population standard deviations
Question 10.158
2. True or false: To perform the F test, the random samples from the two populations may be either dependent samples or independent samples. (p. 618)
Question 10.159
3. True or false: To perform the F test, the two populations must be normally distributed. (p. 618)
10.4.3
True
Question 10.160
4. What is the formula for the test statistic for the F test? (p. 618)
Question 10.161
5. For the F test, what distribution does the test statistic follow? What are the degrees of freedom? (p. 618)
10.4.5
An F distribution with n1−1 degrees of freedom in the numerator and n2−1 degrees of freedom in the denominator.
Question 10.162
6. True or false: The value of the F random variable can be positive or negative. (p. 618)
Question 10.163
7. What does the notation Fα,n1−1,n2−1 represent? (p. 619)
10.4.7
The F−value with df1=n1−1 numerator degrees of freedom and df2=n2−1 denominator degrees of freedom, with area α to the right of Fα,n1−1,n2−1.
Question 10.164
8. Briefly explain how to find the F critical value for a given area α to the left of it. (p. 619)
PRACTICING THE TECHNIQUES
 CHECK IT OUT!
| To do | Check out | Topic |
|---|---|---|
| Exercises 9–20 | Example 19 | Finding critical values of the F distribution |
| Exercises 21–26 | Example 20 |
F test for comparing two population standard deviations: critical-value method |
| Exercises 27–32 | Example 21 |
F test for comparing two population standard deviations: p-value method |
For Exercises 9–12, find the F critical value for a right-tailed test with the given characteristics.
Question 10.165
9. α=0.05, df1=10, df2=9
10.4.9
Fα,n1−1,n2−1=F0.05,10,9=3.14.
Question 10.166
10. α=0.10, df1=10, df2=9
Question 10.167
11. α=0.01, df1=5, df2=4
10.4.11
Fα,n1−1,n2−1=F0.01,5,4=15.52.
Question 10.168
12. α=0.01, df1=5, df2=20
For Exercises 13–16, find the F critical value for a left-tailed test with the given characteristics.
Question 10.169
13. α=0.05, df1=20, df2=3
10.4.13
F1−α,n1−1,n2−1=F0.95,20,3=0.3226.
Question 10.170
14. α=0.01, df1=20, df2=3
Question 10.171
15. α=0.05, df1=3, df2=20
10.4.15
F1−α,n1−1,n2−1=F0.95,3,20=0.1155.
Question 10.172
16. α=0.01, df1=3, df2=20
For Exercises 17–20, find the F critical value for a two-tailed test with the given characteristics.
Question 10.173
17. α=0.05, df1=15, df2=6
10.4.17
Fα/2,n1−1,n2−1=F0.025,15,6=5.27,F1−α/2,n1−1,n2−1=F0.975,15,6=0.2933.
Question 10.174
18. α=0.10, df1=30, df2=100
Question 10.175
19. α=0.05, df1=6, df2=15
10.4.19
Fα/2,n1−1,n2−1=F0.025,6,15=3.41,F1−α/2,n1−1,n2−1=F0.975,6,15=0.1898.
Question 10.176
20. α=0.10, df1=60, df2=100
For Exercises 21–26, assume that the populations are independent and normally distributed. Perform the indicated hypothesis tests using the critical-value method. For each exercise
- State the hypotheses.
- Find the critical value(s) and state the rejection rule.
- Find Fdata.
- State the conclusion and interpretation.
Question 10.177
21. H0:σ1=σ2 vs. Ha:σ1>σ2,α=0.05,n1=11,n2=7,s1=2,s2=1
10.4.21
(a) H0:σ1=σ2 vs. Ha:σ1>σ2 (b) Fcrit=Fα,n1−1,n2−1=F0.05,10,6=4.06. Reject H0 if Fdata≥4.06. (c) Fdata=4. (d) Since Fdata=4 is not ≥4.06, we do not reject H0. There is insufficient evidence at the α=0.05 level of significance that the population standard deviation of Population 1 is greater than the population standard deviation of Population 2.
Question 10.178
22. H0:σ1=σ2 vs. Ha:σ1<σ2,α=0.05,n1=16,n2=8,s1=2,s2=3
Question 10.179
23. H0:σ1=σ2 vs. Ha:σ1<σ2,α=0.10,n1=10,n2=21,s1=2.5,s2=3.5
10.4.23
(a) H0:σ1=σ2 vs. Ha:σ1<σ2 (b) Fcrit=F1−α,n1−1,n2−1=F0.90,9,20=0.4348. Reject H0 if Fdata≤0.4348. (c) Fdata=0.5102. (d) Since Fdata=0.5102 is not ≤0.4348, we do not reject H0. There is insufficient evidence at the α=0.10 level of significance that the population standard deviation of Population 1 is less than the population standard deviation of Population 2.
Question 10.180
24. H0:σ1=σ2 vs. Ha:σ1>σ2,α=0.10,n1=31,n2=7,s1=10.2,s2=5.1
Question 10.181
25. H0:σ1=σ2 vs. Ha:σ1≠σ2,α=0.05,n1=6,n2=13,s1=3.1,s2=1.3
10.4.25
(a) H0:σ1=σ2 vs. Ha:σ1≠σ2 (b) Fcrit=Fα/2,n1−1,n2−1=F0.025,5,12=3.89 and Fcrit=F1−α/2,n1−1,n2−1=F0.975,5,12=0.1511. Reject H0 if Fdata≥3.89 or if Fdata≤0.1511. (c) Fdata=5.686. (d) Since Fdata=5.686 is ≥3.89, we reject H0. There is evidence at the α=0.05 level of significance that the population standard deviation of Population 1 differs from the population standard deviation of Population 2.
Question 10.182
26. H0:σ1=σ2 vs. Ha:σ1≠σ2,α=0.05,n1=21,n2=7,s1=10.7,s2=9.9
For Exercises 27–32, assume that the populations are normally distributed. Perform the indicated hypothesis tests using the p-value method. For each exercise,
- State the hypotheses and the rejection rule.
- Find Fdata.
- Find the p-value.
- State the conclusion and interpretation.
Question 10.183
27. H0:σ1=σ2 vs. Ha:σ1>σ2,α=0.01,n1=9,n2=16,s1=5,s2=3
10.4.27
(a) H0:σ1=σ2 vs. Ha:σ1>σ2. Reject H0 if the p-value≤0.01.
(b) Fdata=2.778 (c) p–value=0.0420. (d) Since the p–value=0.0420 is not ≤0.01, we do not reject H0. There is insufficient evidence at the α=0.01 level of significance that the population standard deviation of Population 1 is greater than the population standard deviation of Population 2.
Question 10.184
28. H0:σ1=σ2 vs. Ha:σ1<σ2,α=0.01,n1=21,n2=7,s1=4,s2=7
Question 10.185
29. H0:σ1=σ2 vs. Ha:σ1<σ2,α=0.05,n1=16,n2=21,s1=2.8,s2=5.2
10.4.29
(a) H0:σ1=σ2 vs. Ha:σ1<σ2. Reject H0 if the p–value≤0.05.
(b) Fdata=0.2899 (c) p–value=0.0090. (d) Since the p–value=0.0090 is ≤0.05, we reject H0. There is evidence at the α=0.05 level of significance that the population standard deviation of Population 1 is less than the population standard deviation of Population 2.
Question 10.186
30. H0:σ1=σ2 vs. Ha:σ1>σ2,α=0.05,n1=51,n2=101,s1=25.1,s2=12.7
Question 10.187
31. H0:σ1=σ2 vs. Ha:σ1≠σ2,α=0.10,n1=8,n2=8,s1=150,s2=150
10.4.31
(a) H0:σ1=σ2 vs. Ha:σ1≠σ2. Reject H0 if the p–value p-value≤0.10.
(b) Fdata=1 (c) p–value≤1. (d) Since the p–value≤1 is not ≤0.10, we do not reject H0. There is insufficient evidence at the α=0.10 level of significance that the population standard deviation of Population 1 is different from the population standard deviation of Population 2.
Question 10.188
32. H0:σ1=σ2 vs. Ha:σ1≠σ2,α=0.10,n1=11,n2=26,s1=15.1,s2=20.6
APPLYING THE CONCEPTS
Question 10.189
33. Body Mass Index. The body mass index (BMI) is a statistical measure of an individual's body weight, based on his or her weight and height. In the Framingham Heart Study,18 a sample of 1160 males had a mean BMI of 25.5 with a sample standard deviation of 3.3, and a sample of 1571 women had a mean BMI of 24.8 with a sample standard deviation of 4.3. Test whether the population standard deviation of the males' BMI is less than that of the females, using α=0.05. Assume that the samples are independent and that the two populations are normally distributed.
10.4.33
Critical-value method: H0:σ1=σ2 vs. Ha:σ1<σ2. Fcrit=F1−α,n1−1,n2−1=F0.95,1159,1570=0.9009. Reject H0 if Fdata≤0.9009. Fdata≤0.5890. Since Fdata=0.5890 is ≤ 0.9009, we reject H0. There is evidence at the α=0.05 level of significance that the population standard deviation of the males' BMI is less than the population standard deviation of the females' BMI. p–value method: H0:σ1=σ2 vs. Ha:σ1<σ2. Reject H0 if the p-value≤0.05. Fdata=0.5890. p-value=0. Since the p–value =0 is ≤ 0.05, we reject H0. There is evidence at the α=0.05 level of significance that the population standard deviation of the males' BMI is less than the population standard deviation of the females' BMI.
Question 10.190
34. Smoking. A research paper19 described two common types of smokers: (a) Morning Highs: those who tend to smoke more in the morning than the rest of the day, and (b) Flatlines: those who tend to smoke at the same rate all day. A sample of 43 smokers from the Morning High group had a mean of 30.7 cigarettes smoked per day, with a sample standard deviation of 10.5 cigarettes. A sample of 247 smokers from the Flatline group had a mean of 22.0 cigarettes smoked per day, with a sample standard deviation of 7.7 cigarettes. Test whether the population standard deviation of the Morning High group is greater than that of the Flatline group, using α=0.10. Assume that the samples are independent and that the two populations are normally distributed.
Question 10.191
35. Autism and Asperger's Syndrome. A study20 compared the IQ scores of children with autism and children with Asperger's syndrome. A sample of 85 children with autism had a mean IQ of 72.71 with a sample standard deviation of 15.08. A sample of 341 children with Asperger's syndrome had a mean IQ of 95.76 with a sample standard deviation of 16.56. Test whether the population standard deviations of the two groups differ, using α=0.10. Assume that the samples are independent and that the two populations are normally distributed.
10.4.35
Critical-value method: H0:σ1=σ2 vs. Ha:σ1≠σ2. Fcrit=Fα/2,n1−1,n2−1=F0.05,84,340=1.39 and Fcrit=F1−α/2,n1−1,n2−1=F0.95,84,340=0.6623. Reject H0 if Fdata≤0.6623 or if Fdata≥1.39. Fdata=0.8292. Since Fdata=0.8292 is not ≤ 0.6623 and not ≥1.39, we do not reject H0. There is insufficient evidence at the α=0.10 level of significance that the population standard deviation of the IQ scores of children with autism differs from the population standard deviation of the IQ scores of children with Asperger's syndrome. p–value method: H0:σ1=σ2 vs. Ha:σ1≠σ2. Reject H0 if the p–value≤0.10. Fdata=0.8292. p–value=0.3031. Since the p–value=0.3031 is not ≤ 0.10, we do not reject H0. There is insufficient evidence at the α=0.10 level of significance that the population standard deviation of the IQ scores of children with autism differs from the population standard deviation of the IQ scores of children with Asperger's syndrome.
Question 10.192
36. Blood Pressure. A recent study21 compared the systolic blood pressure readings of two groups of adults: those ages 30–44 and those ages 70-79. A random sample of 100 individuals in the younger group had a sample mean systolic blood pressure reading of 111, with a sample standard deviation of 5. A random sample of 100 individuals in the older group had a sample mean systolic blood pressure reading of 134, with a sample standard deviation of 13. Test whether the population standard deviation of the younger group is less than that of the older group, using α=0.05. Assume that the samples are independent and that the two populations are normally distributed.
Question 10.193
37. Gold and Silver Prices. We are interested in testing whether the variability in gold prices exceeds that of silver prices. Refer to the following data, which represent random samples of the prices taken between June 2009 and July 2010, and the following normal probability plots.
gold
silver
- Do the probability plots indicate violation of the normality assumption?
Gold 1121.5 1128 1086.8 1098.25 1114 1104.25 1123.5 1154.5 1185 1236 1227.75 1225 1234 1208 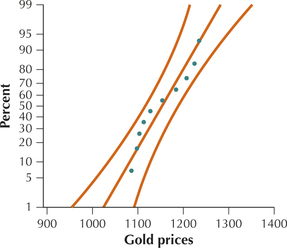
Silver 17.17 18.52 16.23 15.57 16.50 17.02 17.69 18.27 18.71 19.11 18.30 18.42 18.65 18.42 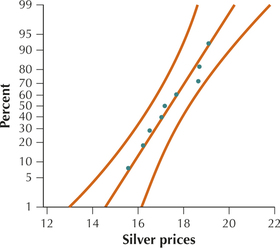
- Test whether the population standard deviation of gold prices is greater than that of silver prices, using α=0.01. Assume that the samples are independent.
10.4.37
(a) No (b) Critical-value method: H0:σ1=σ2 vs. Ha:σ1>σ2. Fcrit=Fα,n1−1,n2−1=F0.01,13,13=4.16. Reject H0 if Fdata≥4.16. Fdata=3173.62408/1.164810989≈2724.5829. Since Fdata≈2724.5829 is ≥ 4.16, we reject H0. There is evidence at the α=0.01 level of significance that the population standard deviation of gold prices is greater than the population standard deviation of silver prices. p–value method: H0:σ1=σ2 vs. Ha:σ1>σ2. Reject H0 if the p-value≤0.01. Fdata=3173.62408/1.164810989≈2724.5829.p-value≈0. Since the p–value≈0 is ≤ 0.01, we reject H0. There is evidence at the α=0.01 level of significance that the population standard deviation of gold prices is greater than the population standard deviation of silver prices.
Question 10.194
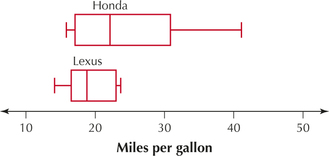
38. Miles per Gallon. The following data represent the combined (city and highway) fuel efficiency in miles per gallon (mpg) for independent random samples of models manufactured by Honda and Lexus.
| Honda car | mpg | Lexus car | mpg |
|---|---|---|---|
| Accord | 24 | GX 470 | 15 |
| Odyssey | 18 | LS 460 | 18 |
| Civic Hybrid | 42 | RX 350 | 19 |
| Fit | 31 | IS 350 | 20 |
| CR-V | 23 | GS 450 | 23 |
| Ridgeline | 17 | IS 250 | 24 |
| S2000 | 21 |
- The boxplots represent the miles per gallon for each manufacturer. Based on this graph, would you expect that the standard deviations of the two manufacturers are the same or different? Why?
- Note: Normal probability plots indicate that the normality assumption is not violated. Test whether the population standard deviations of the two manufacturers' fuel efficiency differ, using α=0.10.