14.4 Wilcoxon Rank Sum Test for Two Independent Samples
 This page includes Video Technology Manuals
OBJECTIVE By the end of this section, I will be able to …
- Perform the Wilcoxon rank sum test for the difference in population medians, using two independent samples
In Section 14.3, we compared data from dependent samples. Here, in Section 14.4, we analyze data from independent samples. Recall from Section 10.1 that two samples are independent when the subjects selected for the first sample do not determine the subjects in the second sample. In Section 10.2, we learned how to perform a hypothesis test for the difference in population means using two independent samples. The two-sample t test that we learned in that section required either that each sample size be large (at least 30) or that each population be normally distributed. Here, in Section 14.4, we will learn about the Wilcoxon rank sum test for the difference in population medians using two independent samples, which has less stringent conditions.
1 Wilcoxon Rank Sum Test for the Difference in Population Medians Using Two Independent Samples
The Wilcoxon rank sum test is equivalent to the Mann-Whitney test, another nonparametric test used in some textbooks to test for the difference in population medians. (By an “equivalent hypothesis test,” we mean a hypothesis test that is applicable to the same situations and always provides the same conclusions.)
The requirements for the Wilcoxon rank sum test are less strict, as we shall see.
The Wilcoxon rank sum test is a nonparametric hypothesis test in which the original data from two independent samples are transformed into their ranks. It tests whether the two population medians are equal or not.
In the Wilcoxon rank sum test, the two samples are temporarily combined, and the ranks of the combined data values are calculated. Then the ranks are summed separately for each sample.
- R1=the sum of the ranks for the first sample
- R2=the sum of the ranks for the second sample
EXAMPLE 13 Finding the ranks of combined data and summing the ranks for each sample
The following table shows the pulse rates in beats per minute for a random sample of five women and a random sample of four men.
- Combine the data sets and find the ranks.
- Find the sum of the ranks for the women and the sum of the ranks for the men.
Women 66 77 57 62 68 Men 79 71 68 71
Solution
We temporarily combine the two samples and arrange the values in increasing order. We then rank the data values from smallest to largest, as shown in the following table. Note that we have two pulse rates of 68 beats per minute. Had these not been tied, they would have had ranks 4 and 5. We therefore assign to each the mean rank (4+5)/2=4.5. Similarly, the two pulse rates of 71 beats per minute are assigned the mean rank (6+7)/2=6.5.
Page 14-30Combined data 57 62 66 68 68 71 71 77 79 Rank 1 2 3 4.5 4.5 6.5 6.5 8 9 The sum of the ranks for the women is
R1=1+2+3+4.5+8=18.5
The sum of the ranks for the men is
R2=4.5+6.5+6.5+9=26.5
NOW YOU CAN DO
Exercises 7–10.
Suppose we have two independent samples. Let M1 and M2 represent the population median of the first and second samples, respectively. Then we have the following two-tailed hypotheses for the Wilcoxon rank sum test:
H0:M1=M2versusHa:M1≠M2
The null hypothesis states that the two populations have the same median. If this is true, we expect that R1, the sum of the ranks for the first sample, will not be very different from R2, the sum of the ranks for the second sample. Large differences between R1 and R2 will therefore lead us to reject the null hypothesis that no difference exists in the population medians. When the conditions are met, the distribution of R1 follows an approximately normal distribution.
When performing the Wilcoxon rank sum test, we need to find R1 only, the sum of the ranks for the first sample. It is not necessary to find the sum of the ranks for the second sample, R2.
Wilcoxon Rank Sum Test for Two Independent Samples
The requirements are that (a) the samples are independent random samples, (b) each sample size is larger than 10, and (c) the shapes of the distributions are the same. It is not required that the populations be normally distributed. Note: In this section, we assume that condition (c) is satisfied.
Step 1 State the hypotheses.
Choose one of the forms in Table 13.
Table 14.41: Table 13 Hypotheses for the Wilcoxon rank sum testNull hypothesis Alternative hypothesis Type of test H0:M1=M2 Ha:M1>M2 Right-tailed test H0:M1=M2 Ha:M1<M2 Left-tailed test H0:M1=M2 Ha:M1≠M2 Two-tailed test Step 2 Find the critical value and state the rejection rule.
Use Table 14 to find the critical value and the rejection rule.
Table 14.42: Table 14 Critical values and rejection rules for the Wilcoxon rank sum testForm of hypothesis test Right-tailed Left-tailed Two -tailed H0:M1=M2Ha:M1>M2 H0:M1=M2Ha:M1<M2 H0:M1=M2Ha:M1≠M2 α=0.10 Zcrit=1.28 Zcrit=−1.28 Zcrit=1.645 α=0.05 Zcrit=1.645 Zcrit=−1.645 Zcrit=1.96 α=0.01 Zcrit=2.33 Zcrit=−2.33 Zcrit=2.58 Rejection rule Reject H0 ifZdata≥Zcrit Reject H0 ifZdata≤Zcrit Reject H0 ifZdata≤−Zcrit or ifZdata≥Zcrit Page 14-31Step 3 Find the value of the test statistic Zdata.
Zdata=R1−μRσR
where
μR=n1(n1+n2+1)2σR=√n1n2(n1+n2+1)12
n1 and n2 represent the sample sizes for samples 1 and 2, respectively, and R1=the sum of the ranks for the first sample.
- Step 4 State the conclusion and the interpretation. Compare the test statistic with the critical value, using the rejection rule.
EXAMPLE 14 Performing the Wilcoxon rank sum test
We are interested in testing whether the population median pulse rate for women (Population 1) is less than that for men (Population 2). We use the data from Example 13 supplemented with an additional seven women and seven men, sampled randomly and independently. The data are presented below.8 Perform the Wilcoxon rank sum test at level of significance α=0.05.
| Women | 66 | 77 | 57 | 62 | 68 | 78 | 73 | 81 | 84 | 69 | 62 | 79 |
| Men | 79 | 71 | 68 | 71 | 68 | 86 | 73 | 58 | 68 | 74 | 78 |
Solution
The data were obtained using random samples. Also, we assume that the distributions of the populations have the same shape. Also, we have n1=12 and n2=11, so the conditions for performing the Wilcoxon rank sum test are satisfied.
Step 1 State the hypotheses. The key words “less than” indicate that we have a left-tailed test, from Table 13:
H0:M1=M2versusHα:M1<M2
where M1 and M2 represent the population median pulse rates of the first (women) and second (men) samples, respectively.
- Step 2 Find the critical value and state the rejection rule. The level of significance is α=0.05, so from Table 14 our critical value is Zcrit=−1.645, and our rejection rule is to reject H0 if Zdata≤−1.645.
Step 3 Find the value of the test statistic. We combine the two samples and arrange in increasing order. We then rank the data values from smallest to largest, as shown in the following table, assigning ties to the mean rank value.
Combined data 57 58 62 62 66 68 68 68 68 69 71 71 Rank 1 2 3.5 3.5 5 7.5 7.5 7.5 7.5 10 11.5 11.5 Combined data 73 73 74 77 78 78 79 79 81 84 86 Rank 13.5 13.5 15 16 17.5 17.5 19.5 19.5 21 22 23 The sum of the ranks for the women is
R1=1+3.5+3.5+5+7.5+10+13.5+16+17.5+19.5+21+22=140
Page 14-32We have
μR=n1(n1+n2+1)2=12(12+11+1)2=144σR=√n1n2(n1+n2+1)12=√12(11)(12+11+1)12≈16.2481
So that
Zdata=R1-μRσR≈140−14416.2481≈-0.2462
- Step 4 State the conclusion and the interpretation. We said in Step 2 that we would reject H0 if Zdata≤−1.645. But Zdata≈−0.2462, which is not ≤ −1.645. Therefore, our conclusion is to not reject H0. There is insufficient evidence that the population median pulse rate for women is less than that for men.
NOW YOU CAN DO
Exercises 11–14.
EXAMPLE 15 Performing the Wilcoxon rank sum test using technology

A study investigated whether there was a difference in physical activity levels between female adolescents with anorexia nervosa (AN) and those without AN.9 In this study, the amount of physical activity (in minutes for the year) of n1=314 randomly selected female adolescents with AN (patients) and n2=340 randomly selected female adolescents without AN (controls) was estimated by interviewing their mothers. The samples were drawn independently. Use Minitab and SPSS to test whether the population median minutes of physical activity for the patients differs from that for the controls, using level of significance α=0.01.
Solution
Because both the patients and the controls were randomly selected, because n1>10 and n2>10, and because we assume that both population shapes are the same, we may proceed with the hypothesis test.
Step 1 State the hypotheses.
H0:M1=M2versusHa:M1≠M2
where M1 and M2 represent the population median activity level (in minutes) of the patients and the controls, respectively.
- Step 2 Find the critical value and state the rejection rule. The level of significance is , so our critical value is . We will reject if or if .
Step 3 Find the value of the test statistic. We use the instructions provided in the Step-by-Step Technology Guide at the end of this section. Figure 16 shows the Minitab results from the Mann-Whitney test, which is equivalent to the Wilcoxon rank sum test for independent samples. Figure 17 shows the SPSS results from the Mann-Whitney test.
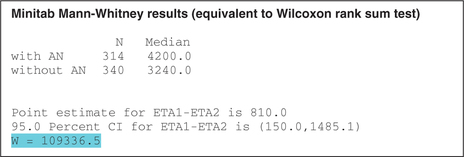 FIGURE 16 Minitab results.Page 14-33
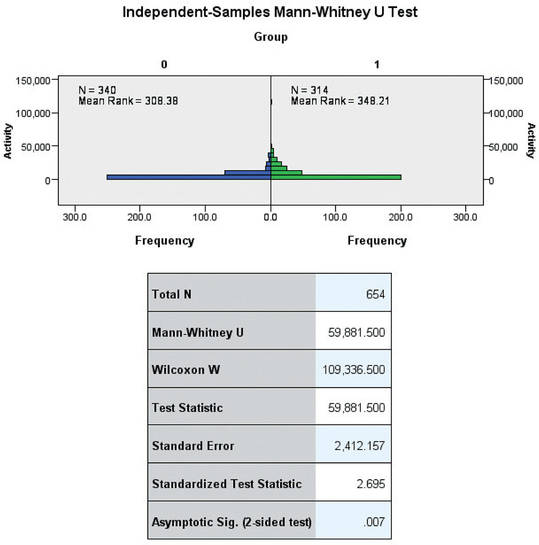 FIGURE 17 SPSS results.
The highlighted represents in our notation. We have
So that
- Step 4 State the conclusion and the interpretation. We said we will reject if or if . We have , which is greater than 2.58. Therefore, we reject . There is evidence that the population median amount of physical activity for female adolescents with AN differs from the population median amount of physical activity for female adolescents without AN.