Section 6.5Exercises
CLARIFYING THE CONCEPTS
Question 6.346
1. What does the word standardize mean? Explain how we use standardization in solving normal probability problems. (p. 368)
6.5.1
To standardize things means to make them all the same, uniform, or equivalent. To standardize a normal random variable X, we transform X into the standard normal random variable Z using the formula Z=X−σ. We do this so that we can use the standard normal table to find the probabilities.
Question 6.347
2. When finding a data value for a specified probability, explain why we can't just report the -value but must transform back to the original normal distribution. (p. 372)
PRACTICING THE TECHNIQUES
 CHECK IT OUT!
| To do | Check out | Topic |
|---|---|---|
| Exercises 3–9 | Example 38 | Finding probability for a normal random variable |
| Exercises 10–14 | Example 39 | Finding probability that lies between two given values |
| Exercises 15–22 | Example 40 | Finding a normal data value for a given area |
| Exercises 23–26 | Example 41 | Finding the -values that mark the boundaries of the middle 95% of -values |
| Exercises 27–30 | Example 43 | Normal probability plots |
For Exercises 3–14, assume that the random variable is normally distributed with mean and standard deviation . Draw a graph of the normal curve with the desired probability and value of indicated. Find the indicated probabilities by standardizing to
Question 6.348
3.
6.5.3
0.5
Question 6.349
4.
Question 6.350
5.
6.5.5
0.8413
Question 6.351
6.
Question 6.352
7.
6.5.7
0.0062
Question 6.353
8.
Question 6.354
9.
6.5.9
0.9332
Question 6.355
10.
Question 6.356
11.
6.5.11
0.8400
Question 6.357
12.
Question 6.358
13.
6.5.13
0.0049
Question 6.359
14.
For Exercises 15–26, assume that the random variable is normally distributed with mean and standard deviation . Draw a graph of the normal curve with the desired probability and value of indicated. Find the indicated values of using the formula .
Question 6.360
15. The value of larger than 95% of all -values (that is, the 95th percentile)
6.5.15
86.45; see Solutions Manual for graph.
Question 6.361
16. The value of smaller than 95% of all -values
Question 6.362
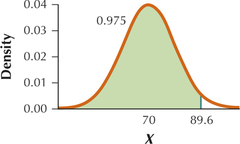
17. The value of larger than 97.5% of all -values
6.5.17
89.6
Question 6.363
18. The value of smaller than 97.5% of all -values
Question 6.364
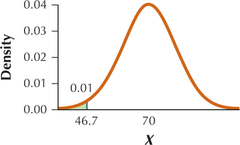
19. The 1st percentile
6.5.19
46.7
Question 6.365
20. The 99th percentile (note that the 1st and 99th percentiles are symmetric values of that contain the central 98% of the area under the curve between them)
Question 6.366
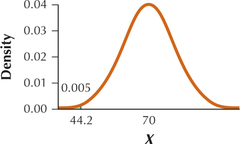
21. The 0.5th percentile
6.5.21
44.2
Question 6.367
22. The 99.5th percentile
Question 6.368
23. The two symmetric values of that contain the central 90% of -values between them
6.5.23
53.55 and 86.45; see Solutions Manual for graph.
Question 6.369
24. The two symmetric values of that contain the central 95% of -values between them
Question 6.370
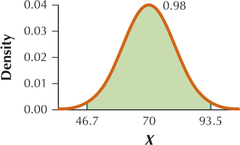
25. The two symmetric values of that contain the central 98% of -values between them
6.5.25
46.7 and 93.3
Question 6.371
26. The two symmetric values of that contain the central 99% of -values between them
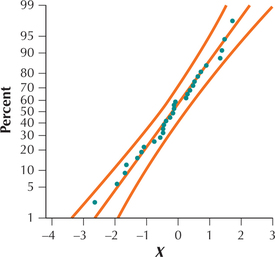
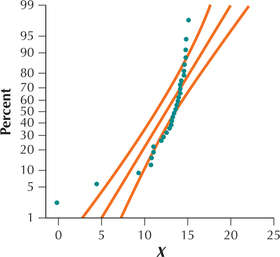
For Exercises 27–30, determine whether the normal probability plots indicate acceptable normality of the data set.
Question 6.372
27.
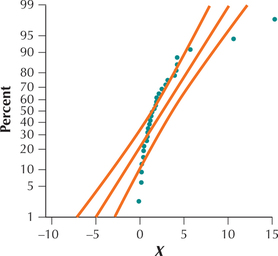
6.5.27
No
Question 6.373
28.
Question 6.374
29.
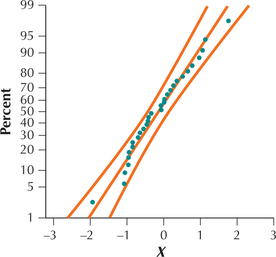
6.5.29
Yes
Question 6.375
30.
APPLYING THE CONCEPTS
Question 6.376
31. Hungry Babies. Six-week-old babies consume a mean of ounces of milk per day, with a standard deviation of 2 ounces. Assume that the distribution is normal. Find the probability that a randomly chosen baby consumes the following amounts of milk per day:
- Less than 15 ounces
- More than 17 ounces
- Between 17 and 19 ounces
6.5.31
(a) 0.5 (b) 0.1587 (c) 0.1359
Question 6.377
32. Speed Kills Your Wallet. NerdWallet.com reported in 2014 that the average auto insurance increase for drivers sustaining a 15 miles per hour over the limit speeding ticket is $124.80 per year. Assume that the distribution is normal with mean and standard deviation . Find the probability that a randomly selected driver with such a ticket received the following car insurance increases:
- More than $150
- Less than $100
- Between $100 and $150
Question 6.378
33. Windy Frisco. The mean wind speed in San Francisco is 13.6 mph in July, according to the U.S. National Oceanic and Atmospheric Administration. Suppose that the distribution of the wind speed in July in San Francisco is normal with mean and standard deviation . Find the probability that a randomly chosen day in July has the following wind speeds:
- 7.2 mph or less
- Greater than 20 mph
- Between 15 and 20 mph
- Tours to Alcatraz Island are canceled if the day is too windy, specifically if the wind speed is higher than 99% of all other wind speeds in July. Find the cutoff wind speed.
- Suppose that a particular day in July has no wind at all. Should this be considered unusual? On what do you base your answer?
6.5.33
(a) 0.1423 (b) 0.1423 (c) 26.67% (d) (e) -score is −2.27; moderately unusual
Question 6.379
34. Facebook Friends. Statistica.com reported in 2014 that the mean number of Facebook friends for 18- to 24-year-olds is 649. Assume the distribution is normal with and standard deviation . Find the probability that a randomly selected Facebook user has the following number of friends:
- Fewer than 424 friends.
- More than 949 friends.
- Between 424 and 949 friends.
- Find the number of Facebook friends that represents the 75th percentile.
- One particular Facebook user has 1174 friends. Is this unusual? On what do you base your answer?
Question 6.380
35. Hungry Babies. Refer to Exercise 31.
- Find the amount of milk greater than 95% of all values of .
- Find the amount of milk less than 95% of all values of .
- Compute the two symmetric amounts of milk and that contain the central 90% of -values between them.
6.5.35
(a) 18.29 ounces (b) 11.71 ounces (c) 11.71 ounces and 18.29 ounces
Question 6.381
36. Speed Kills Your Wallet. Refer to Exercise 32.
- Calculate the auto insurance increase greater than 99% of all values of .
- Compute the auto insurance increase less than 99% of all values of .
- Find the two symmetric auto insurance increases and that contain the central 98% of -values between them.
Question 6.382
37. Windy Frisco. Refer to Exercise 33.
- Find the 90th percentile of wind speeds.
- Find the 10th percentile of wind speeds.
- Calculate the two symmetric wind speeds and that contain the central 80% of -values between them.
6.5.37
(a) 21.28 mph (TI-83/84: 21.29 mph) (b) 5.92 mph (TI-83/84: 5.91 mph) (c) 5.92 (5.91) mph and 21.28 (21.29) mph
Question 6.383
38. Facebook Friends. Refer to Exercise 34.
- A Facebook newbie has a number of friends equal to the 5th percentile. Find the 5th percentile of Facebook friends.
- An online socialite has the 95th percentile of friends. Compute the 95th percentile.
- Calculate the two symmetric numbers of friends and that contain the central 90% of -values between them. Is there a shortcut you can take?
- Calculate the two symmetric numbers of friends and that contain the central 95% of -values between them.
 What if we calculate the two symmetric numbers of friends that contain an unknown value greater than 95% between them? Will the values and be closer together or farther apart than the 95% case? Explain.
Question 6.384
39. Hospital Patient Length of Stays. The Agency for Healthcare Research and Quality reported that the mean length of patient hospital stays in 2012 was 4.9 days. Assume that the distribution of patient length of stays is normal, with a standard deviation of 1 day.
- Find the probability that a randomly selected patient has a length of stay of greater than 7 days.
- What proportion of patient lengths of stay are between 3 and 5 days?
- Find the 50th percentile of patient lengths of stay. What is the relationship between the mean and the median for normal distributions?
- A particular patient had a length of stay of 8 days. Determine whether this is unusual.
6.5.39
(a) 0.0179 (b) 0.5111 (c) 4.9 days; (d) Yes;
Question 6.385
40. Tobacco-Related Deaths. The World Health Organization states that tobacco is the second leading cause of death in the world. Every year, a mean of 5 million people die of tobacco-related causes. Assume that the distribution is normal with and .
- Find the probability that more than 4 million people will die of tobacco-related causes in a particular year.
- Find the 25th percentile of the distribution of tobacco-related deaths.
- Is there a way you can use symmetry and your answer to part (c) to find the 75th percentile of the distribution of tobacco-related deaths?
- In one particular year, 8 million people died from tobacco-related causes. Determine whether this is unusual.
Question 6.386
41. Price of Crude Oil. The Organization of Petroleum Exporting States reports that the mean price for crude oil in July 2014 was $105.115 (one hundred five dollars, eleven and a half cents) per barrel. Assume the data is normal with mean and standard deviation .
- Find the probability that price falls below $100.
- What proportion of barrels sell for between $90 and $115?
- A low price for oil has a price lower than 99.5% of all other prices. Find the price this represents.
- A high price for oil has a price higher than 99.5% of all other prices. Find the price this represents.
- Calculate the two symmetric prices for oil and that contain the central 99% of -values between them. Is there a shortcut you can take?
6.5.41
(a) 0.2643 (b) 0.8643 (c) $84.36 (d) $125.64 (e) $84.36 and $125.64; yes, use the answers to (c) and (d)
Question 6.387
42. Calories per Gram. The histogram shows the number of calories per gram for 961 food items. Assume that the population mean calories per gram is 2.25 with a standard deviation of 2.
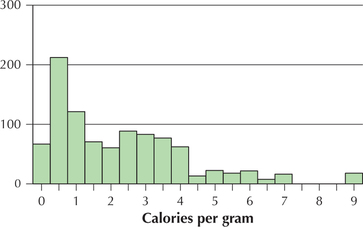
- Assuming that the data follow a normal distribution, what is the 5th percentile of calories per gram?
- Comment on whether your answer from (a) makes any sense.
- The actual 5th percentile for this data set is 0.2 calorie per gram. Looking at the histogram, does this make more sense than your answer from (a)?
- Why is your answer in (a) wrong?
![]() Use the Normal Density Curve applet for Exercise 43.
Use the Normal Density Curve applet for Exercise 43.
Question 6.388
43. Use the applet to find the answers to the following exercises from this section:
- Exercise 35(a)
- Exercise 35(b)
- Exercise 36(a)
- Exercise 37(a)
- Exercise 37(c)
6.5.43
For the graphs see the Solutions Manual. (a) 18.29 ounces (b) 11.71 ounce; (c) $171.40 (d) 21.28 mph (e) 5.92 mph and 21.28 mph
BRINGING IT ALL TOGETHER
 Chapter 6 Case Study: SAT Scores and AP Exam Scores.
The College Board reported in 2013 that females taking the Writing SAT had a mean score of with a standard deviation of , whereas males had a mean score of with a standard deviation of . Assume both sets of scores follow a normal distribution. Use this information for Exercises 44–48.
Question 6.389
44. Suppose students win a writing scholarship if they score above 700 on the Writing SAT.
- Calculate the proportion of females who will be awarded the writing scholarship.
- Compute the percentage of males who will win the writing scholarship.
- Compare your answers to (a) and (b). Explain why this makes sense, given the values of and .
Question 6.390
45. Suppose students are identified as at-risk writers if they score below 400 on the Writing SAT.
- Calculate the proportion of females who will be identified as at-risk writers.
- Compute the percentage of males who will be identified as at-risk writers.
- Compare your answers to (a) and (b). Explain why this makes sense, given the values of and .
6.5.45
(a) 0.2033 (b) 0.2389 (c) A higher proportion of males will be identified as at-risk writers than females. This makes sense given that females have a higher average on the Writing SAT test than males.
Question 6.391
46. Calculate the two symmetric female Writing SAT scores and that contain the central 95% of -values between them.
Question 6.392
47. Compute the two symmetric male Writing SAT scores and that contain the central 95% of -values between them.
6.5.47
256.6 and 707.4
Question 6.393
48.What if the female standard deviation was some unknown value greater than Describe how that change would affect the following:
- The difference between and