9.1 Introduction to Hypothesis Testing
 This page includes Statistical Videos
OBJECTIVES By the end of this section, I will be able to …
- Construct the null hypothesis and the alternative hypothesis from the statement of the problem.
- State the two types of errors made in hypothesis tests: the Type I error, made with probability α, and the Type II error, made with probability β.
Researchers are interested in investigating many different types of questions, such as the following:
- An accountant may want to examine whether evidence exists for corporate tax fraud.
- A Department of Homeland Security executive may want to test whether a new surveillance method will uncover terrorist activity.
- A sociologist may want to examine whether the mayor's economic policy is increasing poverty in the city.
Questions such as these can be tackled using statistical hypothesis testing, which is a statistical inference process for using sample data to render a decision about claims regarding the unknown value of a population parameter. In this section, we will learn how to make decisions about the values of a population mean.
1 Constructing the Hypotheses
Let's start with an example.
EXAMPLE 1 Are these dice loaded?
Suppose you are playing a dice game, where you roll a pair of dice and win the sum of the two dice in dollars. A fair price to pay to play this game is $7 a throw, because the long-run mean when tossing two fair dice is 7. Now suppose you have played this game 10 times (paying a total of $70), with the following 10 results from throwing the two dice:
| 4 | 6 | 2 | 7 | 8 | 3 | 5 | 4 | 9 | 2 |
These 10 dice rolls add up to 50, meaning that, for your outlay of $70, you have only received $50 in return. You wonder:
- Are these dice fair but you have just had a streak of bad luck, or
- Are these dice not fair, that is, loaded (weighted) to provide low outcomes?
This is a basic example of hypothesis testing, where we have two competing ideas, and we turn to observed data (the dice rolls) to provide evidence in favor of one idea or the other.
We examine this question in more detail in the exercises and again in Section 9.2.
So, what is a hypothesis?
A hypothesis is a statement made about the value of a parameter. (A parameter is a characteristic of a population, such as the population mean μ.)
Examples of hypotheses might be the following:
- The population mean μ of the dice tossed in Example 1 equals 7, meaning that you just had a run of bad luck.
- The population mean μ of the dice tossed in Example 1 is less than 7, meaning that the dice were loaded.
- The population proportion p of adults owning a tablet computer in 2014 was 42%. A media technology researcher states that this proportion is still the same today.
- A different researcher states that the population proportion p of adults owning a tablet computer has increased since 2014.
Note: A hypothesis is not necessarily true. It is simply a statement. We need to look to the data for evidence either for it or against it.
Note that the statements in (a) and (b) are competing ideas, which can't both be right. Similarly, the statements in (c) and (d) are competing ideas.
The problem is that the value of the parameter is unknown, because it is a characteristic of a population, and we do not have access to the entire population. For example, we do not know the proportion of all people in the world today who own tablets, because new people are buying them all the time. If the true value of the parameter was known, there would be no need to perform a hypothesis test about it. This is why two reasonable people can have different ideas about the value of a population parameter. We must leave it up to the observed (sample) data to provide evidence in favor of a particular hypothesis.
To summarize, we have the following definition of hypothesis testing.
Hypothesis testing is a procedure for:
- stating two competing hypotheses about the unknown value of a population parameter, such as the population mean μ,
- analyzing the evidence collected from sample data, and
- rendering a decision about which hypothesis the sample data support.
The two competing statements about the parameter are called the null hypothesis and alternative hypothesis, and they are described below.
The Hypotheses
- The null hypothesis represents what has been tentatively assumed about the value of the parameter. Thus, it represents no change, no effect, or no difference. The null hypothesis is denoted as H0 (pronounced “H-naught”), and it is assumed true unless the sample data provide evidence against it.
- The alternative hypothesis, or research hypothesis, denoted as Ha, represents an alternative claim about the value of the parameter. If the alternative hypothesis is to be chosen over the null hypothesis, it requires sample evidence in its favor.
Hypothesis testing is like conducting a criminal trial. In a trial in the United States, the defendant is innocent until proven guilty, and the jury must evaluate the truth of two competing hypotheses:
H0:defendant is not guilty versus Ha:defendant is guilty
The not-guilty hypothesis is considered the null hypothesis H0 because the jurors must assume it is true until proven otherwise. The alternative hypothesis Ha, that the defendant is guilty, must be demonstrated to be true, beyond a reasonable doubt. How does a court of law determine whether the defendant is convicted or acquitted? This judgment is based upon the evidence, the hard facts heard in court. Similarly, in hypothesis testing, the researcher draws a conclusion based on the evidence provided by the sample data.
In Sections 9.1–9.4, we will examine hypotheses for the unknown mean μ. The null hypothesis will be a claim about a certain specified value for μ denoted μ0, and the alternative hypothesis will be a claim about other values for μ. The hypotheses have one of the three possible forms shown in Table 1. The right-tailed test and the left-tailed test are called one-tailed tests. In Section 9.2, we will find out why we use this terminology. All of the hypothesis tests we perform in Sections 9.1–9.4 will take one of the three forms in Table 1.
| Form | Null and alternative hypotheses |
|---|---|
| Right-tailed test | H0:μ=μ0 versus Ha:μ>μ0 |
| Left-tailed test | H0:μ=μ0 versus Ha:μ<μ0 |
| Two-tailed test | H0:μ=μ0 versus Ha:μ≠μ0 |
The notation μ0 looks scary, but it just refers to the hypothesized value of μ. The following example will help to clarify.
EXAMPLE 2 An example of hypotheses
Recall the dice-throwing situation in Example 1. Suppose we wanted to conduct a hypothesis test to test whether the population mean μ of the dice tossed in Example 1 is less than 7. State the hypotheses.
Solution
We want to test whether μ is less than 7. The only place a “less than” sign appears in Table 1 is for the left-tailed test:
H0:μ=μ0 versus Ha:μ<μ0
Next, we ask ourselves, “less than what?” The answer to this question, 7, is the value of μ0. That is, μ0=7. The same value μ0=7 goes in both H0 and Ha. Thus, we have our hypotheses:
H0:μ=7 versus Ha:μ<7
Note that we do not perform hypothesis tests about sample characteristics, because we already know the values of these sample statistics. For example, we would never have hypotheses of the form: H0:ˉx=μ0 versus Ha:ˉx>μ0, because, for any given sample, the value of ˉx is known, so there is no need to perform a hypothesis test about it.
EXAMPLE 3 Identifying valid and invalid hypotheses
Determine whether the following hypotheses are in a valid form or not. If not, explain why not, and put the hypotheses in a valid form.
- H0:μ>10 versus Ha:μ=10
- H0:ˉx=25 versus Ha:ˉx<25
- H0:μ=98.6 versus Ha:μ>100
- H0:μ=5 versus Ha:μ≠5
Solution
Invalid. The equal sign always goes in H0. So the correct form is:
H0:μ=10 versus Ha:μ>10
Page 491Invalid. Statistics such as ˉx never appear in the hypotheses (though they are used later on in the hypothesis test procedure) because we know their values. Hypotheses are about parameters such as μ, whose value is unknown. The correct form is:
H0:μ=25 versus Ha:μ<25
Invalid. The same value for μ0 should go in both H0 and Ha. One possible correct form is:
H0:μ=98.6 versus Ha:μ>98.6
- This form for the hypotheses is valid.
NOW YOU CAN DO
Exercises 9–12.
The first task in hypothesis testing is to form hypotheses. To convert a word problem into two hypotheses, look for certain key words that can be expressed mathematically. Table 2 shows how to convert words typically found in word problems into symbols.
| English words | Symbol | Synonyms |
|---|---|---|
| Equal | = | Is; has stayed the same |
| Not equal | ≠ | Is different from; has changed from; differs from |
| Greater than | > | Is more than; exceeds; has increased |
| Less than | < | Is below; is smaller than; has decreased |
Once you have identified the key words, use the associated mathematical symbol to write the two hypotheses. The following strategy can be used to write the hypotheses.
 Do not blindly apply this strategy without thinking about what you are doing. Instead, use the strategy to help formulate your own hypotheses. There is no substitute for thinking through the problem!
Strategy for Constructing the Hypotheses About μ
- Step 1 Search the word problem for certain key English words and select the associated symbol from Table 2.
- Step 2 Determine the form of the hypotheses listed in Table 1 that uses this symbol.
- Step 3 Find the value of μ0 (the number that answers the question: “greater than what?” or “less than what?”) and write your hypotheses in the appropriate forms.
EXAMPLE 4 Applying the strategy for constructing the hypotheses about μ
The mean annual rainfall in Arizona has been eight inches per year, according to the World Almanac. But weather researchers are interested in whether this already small amount of rain will decrease, leading to drought conditions in the state. Use the steps in the Strategy for Constructing the Hypotheses About μ to write a null hypothesis and an alternative hypothesis for this situation.
Solution
Let's use our strategy to construct the hypotheses needed to test this claim.
Step 1 Search the word problem for certain key English words and select the appropriate symbol.
The problem uses the word “decrease,” which means “is less than.” Thus, we will write a hypothesis that contains the < symbol.
Page 492Step 2 Determine the form of the hypotheses.
From Table 1, we see that the symbol < means that we use a left-tailed test:
H0:μ=μ0 versus Ha:μ<μ0
Step 3 Find the value for μ0 and write your hypotheses.
The alternative hypothesis Ha states that the mean annual rainfall in Arizona is less than some value μ0. Less than what? Eight inches per year. Write the two hypotheses with μ0=8.
H0:μ=8 versus Ha:μ<8
NOW YOU CAN DO
Exercises 13–18.
YOUR TURN#1
Use Steps 1–3 in the Strategy for Constructing Hypotheses About μ to construct the hypotheses for the following scenario: Nielsen reports that iPhone and Android users spent 30 hours a month using apps on their devices in 2013. A media technology analyst states that the mean amount of time has increased since 2013. Write a null hypothesis and an alternative hypothesis for this situation.
(The solution is shown in Appendix A.)
Now that we know how to construct hypotheses, we next consider when sufficient evidence exists to reject the null hypothesis.
Statistical Significance
A result is said to be statistically significant if it is unlikely to have occurred due to chance.
EXAMPLE 5 Statistical significance
Suppose that you are a researcher for a pharmaceutical research company. You are investigating the side effects of a new cholesterol-lowering medication and want to determine whether the medication will decrease the population mean systolic blood pressure level from the current population mean of μ=110. If so, then a warning will have to be given not to prescribe the new medication to patients whose blood pressure is already low.
To determine which of these hypotheses is correct, we take a sample of randomly selected patients who are taking the medication. We record their systolic blood pressure levels and calculate the sample mean ˉx and sample standard deviation s. Most likely, the mean of this sample of patients' systolic blood pressure levels will not be exactly equal to 110, even if the null hypothesis is true. Now, suppose that the sample mean blood pressure ˉx is less than the hypothesized population mean of 110. Is the difference due simply to chance variation, or is it evidence of a real side effect of the cholesterol medication?
- Construct the appropriate hypotheses.
- For ˉx=109 and ˉx=90, discuss whether each result would be statistically significant or due to chance.
Solution
The key word “decrease” means we have a left-tailed test. “Less than what?” The current population mean systolic blood pressure of μ=110. Thus, our hypotheses are:
H0:μ=110 versus Ha:μ<110
where μ represents the population mean systolic blood pressure and μ0=110.
Page 493- For ˉx=109, the difference between ˉx and μ0 is only 1. Depending on the variability present in the sample, the researcher would likely not reject the null hypothesis because this small difference is probably due to chance variation. The result is probably not statistically significant. But, for ˉx=90, the difference between ˉx and μ0 is 20. Depending on the variability present in the sample, the researcher would probably conclude that this difference is so large that it is unlikely that it is due to chance variation. Thus, the researcher would probably reject the null hypothesis H0 in favor of the alternative hypothesis Ha. The result is statistically significant.
Note: When we reject H0, we say that the results are statistically significant. If we do not reject H0, the results are not statistically significant.
To summarize:
- In a hypothesis test, we compare the sample mean ˉx with the value μ0 of the population mean used in the H0 hypothesis.
- If the difference between ˉx and μ0 is large, then the null hypothesis H0 is rejected.
- If the difference between ˉx and μ0 is not large, then H0 is not rejected.
The question is, “Where do you draw the line?” Just how large a difference between ˉx and μ0 is large enough to reject the null hypothesis? We answer this question starting in Section 9.2.
Note that there are only two possible hypothesis-testing conclusions:
- Reject H0, or
- Do not reject H0.
Developing Your Statistical Sense
A Decision Is Not Proof
It is important to understand that the decision to reject or not reject H0 does not prove anything. The decision represents whether or not there is sufficient evidence against the null hypothesis. This is our best judgment, given the available data, similar to the best judgment of a jury, given the available evidence. You cannot claim to have proven anything about the value of a population parameter unless you elicit information from the entire population, which is usually not possible.
We can make decisions about population parameters using the limited information available in a sample because we base our decisions on probability. When the difference between the sample mean ˉx and the hypothesized population mean μ0 is large, then the null hypothesis is probably not correct. When the difference is small, then the data are probably consistent with the null hypothesis. But we don't know for sure.
2 Type I and Type II Errors
Next, we take a closer look at some of the thorny issues involved in performing a hypothesis test. Let's return to the example of a criminal trial. The jury will convict the defendant if they find evidence compelling enough to reject the null hypothesis of “not guilty” beyond a reasonable doubt. However, jurors are only human; sometimes their decisions are correct and sometimes they are not. Thus, the jury's verdict will represent one of the following outcomes:
- An innocent defendant is wrongfully convicted.
- A guilty defendant is convicted.
- A guilty defendant is wrongfully acquitted.
- An innocent defendant is acquitted.
Recall that we can write the two hypotheses for a criminal trial as
H0: defendant is not guilty versus Ha:defendant is guilty
Table 3 shows the possible verdicts on the left and the two hypotheses across the top.
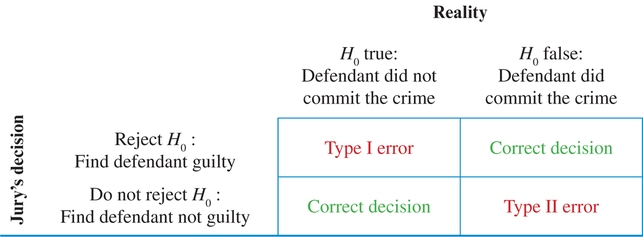
|

Let's look at the two possible decisions the jury can make. It can find the defendant guilty: the jury rejects the claim in the null hypothesis H0. Alternatively, the jury can find the defendant not guilty: the jury does not reject the null hypothesis H0. The jury can render the correct decision in two ways.
Two Ways of Making the Correct Decision
To not reject H0 when H0 is true.
Example: To find the defendant not guilty when, in reality, he did not commit the crime.
To reject H0 when H0 is false.
Example: To find the defendant guilty when, in reality, he did commit the crime.
Unfortunately, the jury can also render an incorrect decision in two ways. In statistics, the two incorrect decisions are called Type I and Type II errors.
Two Types of Errors
Type I error: To reject H0 when H0 is true.
Example: To find the defendant guilty when, in reality, he did not commit the crime.
Type II error: To not reject H0 when H0 is false.
Example: To find the defendant not guilty when, in reality, he did commit the crime.
EXAMPLE 6 Type I and Type II errors
For the medication hypothesis test in Example 5, explain what it would mean if the following errors were made:
- Type I error
- Type II error
Solution
The hypotheses in Example 5 were the following:
H0:μ=110 versus Ha:μ<110
where μ represents the population mean systolic blood pressure.
- A Type I error occurs when we reject H0 when H0 is true. This would be to conclude that μ had decreased when, in reality, it had stayed the same. In other words, a Type I error would be to conclude that the population mean systolic blood pressure had decreased when, in reality, it had not decreased. The pharmaceutical company, afraid of this possible side effect, might not continue production of the drug when, in reality, there is no side effect.
- A Type II error occurs when we do not reject H0 when H0 is false. This would be to conclude that μ had stayed the same when, in reality, it had decreased. In this case, this is a very dangerous error to make, because the pharmaceutical company might then conclude that the side effect does not exist when, in reality, it does exist, and it could lead to dangerous lowering of blood pressure. This is why the Food and Drug Administration requires that strict protocols are followed regarding Type I and Type II errors when approving new medications for the market.
NOW YOU CAN DO
Exercises 19–22.
YOUR TURN#2
Explain what it would mean to make a Type I error and a Type II error for the hypothesis test in the following examples:
(The solutions are shown in Appendix A.)
The probability of a Type I error is denoted as α (alpha). We set the value of α to be some small constant, such as 0.01, 0.05, or 0.10, so that only a small probability of rejecting a true null hypothesis exists.
To say that α=0.05 means that, if this hypothesis test were repeated over and over again, the long-term probability of rejecting a true null hypothesis would be 5%. The level of significance of a hypothesis test is another name for α, the probability of rejecting H0 when H0 is true. A smaller α makes it harder to wrongfully reject H0 just by chance. If the consequences of making a Type I error are serious, then the level of significance should be small, such as α=0.01. If the consequences of making a Type I error are not so serious, then one may choose a larger value for the level of significance, such as α=0.05 or α=0.10.
The probability of a Type II error is denoted as β (beta). This is the probability of not rejecting H0 when H0 is false, such as acquitting someone who is really guilty. Making α smaller inevitably makes β larger (for a fixed sample size). Of course, our goal is to simultaneously minimize both α and β. Unfortunately, the only way to do this is to increase the sample size.