Chapter 12 Introduction
CHAPTER 12
Two-
Why We Use Two-
The More Specific Vocabulary of Two-
Two Main Effects and an Interaction
Interactions and Public Policy
Interpreting Interactions
The Six Steps of Two-
Identifying Four Sources of Variability in a Two-
Effect Size for Two-
BEFORE YOU GO ON
You should understand the six steps of hypothesis testing (Chapter 7).
You should be able to conduct and interpret a one-
way between- groups ANOVA (Chapter 11). You should understand the concept of effect size (Chapter 8) and the measure of effect size for ANOVA, R2 (Chapter 11).
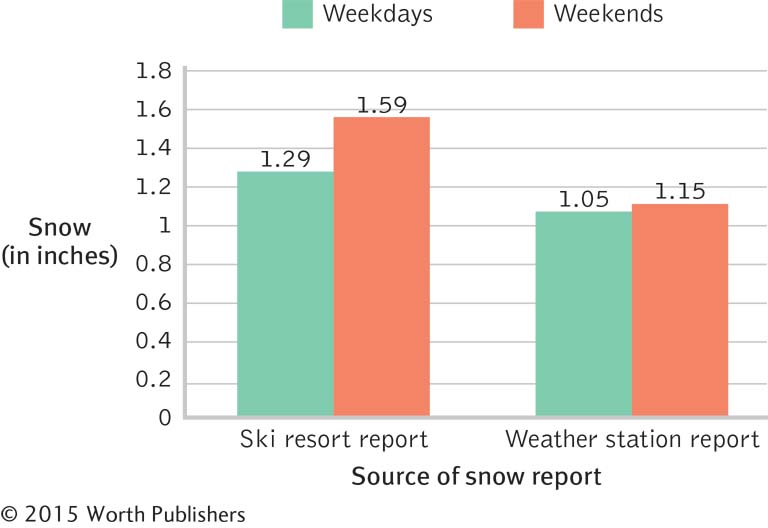
Jonathan Zinman and Eric Zitzewitz are social science researchers and ski bums who live in New Hampshire. They had become annoyed when they hit the slopes only to find that snowfall reports had clearly been exaggerated. So they collected snowfall data both from ski resorts and the weather station for weekdays (when fewer people go skiing or snowboarding) and for the more profitable weekends. Figure 12-1 summarizes what they found: The ski resorts reported greater snowfall than weather stations did, an effect that was even more pronounced on weekends, when such an exaggeration was likely to draw more paying customers.

Ski Bums Beware!
This bar graph tells a useful story for consumers about a statistically significant interaction. Ski resorts tend to exaggerate the amount of snowfall, especially snowfall on weekends.
In the study by Zinman and Zitzewitz (2009), the dependent variable is the amount of snow reported, in inches. But there are two independent variables (source of the snow report and time of the week), and each one seems to have its own effect on the amount of snow reported. Ski resorts reported more snowfall, on average, regardless of whether describing weekday or weekend snowfall, than weather stations did. This is called a main effect of the source of the snow report. Figure 12-1 also shows that snow reports are higher on weekends than on weekdays from either source of the snow report. This is called a main effect of time of the week.
But there is a third finding, and it’s the most interesting one: Ski resorts bumped up their estimates even more on the weekend than they did during the week! So the variable for the source of the report interacted with the variable for the time of week, making its own unique impact on the reported amount of snowfall. This is called an interaction between the variables for the source of the snow report and the time of week.
Armed with empirical evidence of biased reporting, these researchers concluded that skiers and snowboarders could fight back. Zinman and Zitzewitz (2009) wrote: “Near the end of our sample period, a new iPhone application feature makes it easier for skiers to share information on ski conditions in real time. Exaggeration falls sharply, especially at resorts with better iPhone reception.” It’s a great reminder that we can question reported data, create new data, and take advantage of social media to share information in meaningful ways.

With two independent variables and one dependent variable, the experiment contains three comparisons that might influence a skier’s decision about whether to hit the slopes: (1) the source of the snowfall report (ski resort versus weather station); (2) the time of week (weekday versus weekend); and (3) the combined effects of the source of snowfall report and the time of week. In this study, researchers discovered that the combined effects were the most important of the influences on the amount of snowfall reported. The effect of the source of the snowfall report on the amount of snow reported depended on whether it was a weekday or a weekend.
A statistical interaction occurs in a factorial design when two or more independent variables have an effect on the dependent variable in combination that neither independent variable has on its own.
In this chapter, we examine a hypothesis test that checks for the presence of combined effects, also called interactions. A statistical interaction occurs in a factorial design when two or more independent variables have an effect on the dependent variable in combination that neither independent variable has on its own. We learn about interactions in relation to a research design that has two nominal (or sometimes ordinal) independent variables, one scale dependent variable, and a between-