Chapter 15 Introduction

429

CHAPTER 15

Nonparametric Tests

Nonparametric Statistics

An Example of a Nonparametric Test

When to Use Nonparametric Tests

Chi-Square Tests

Chi-Square Test for Goodness of Fit

Chi-Square Test for Independence

Cramér’s V, the Effect Size for Chi Square

Graphing Chi-Square Percentages

Relative Risk

Ordinal Data and Correlation

When the Data Are Ordinal

The Spearman Rank-Order Correlation Coefficient

The Mann–Whitney U Test

BEFORE YOU GO ON

  • You should be able to differentiate between a parametric and a nonparametric hypothesis test (Chapter 7).

  • You should know the six steps of hypothesis testing (Chapter 7).

  • You should understand the concept of effect size (Chapter 8).

  • You should understand the concept of correlation (Chapters 1 and 13)

  • You should know when to use an independent-samples t test (Chapter 10).

430

image
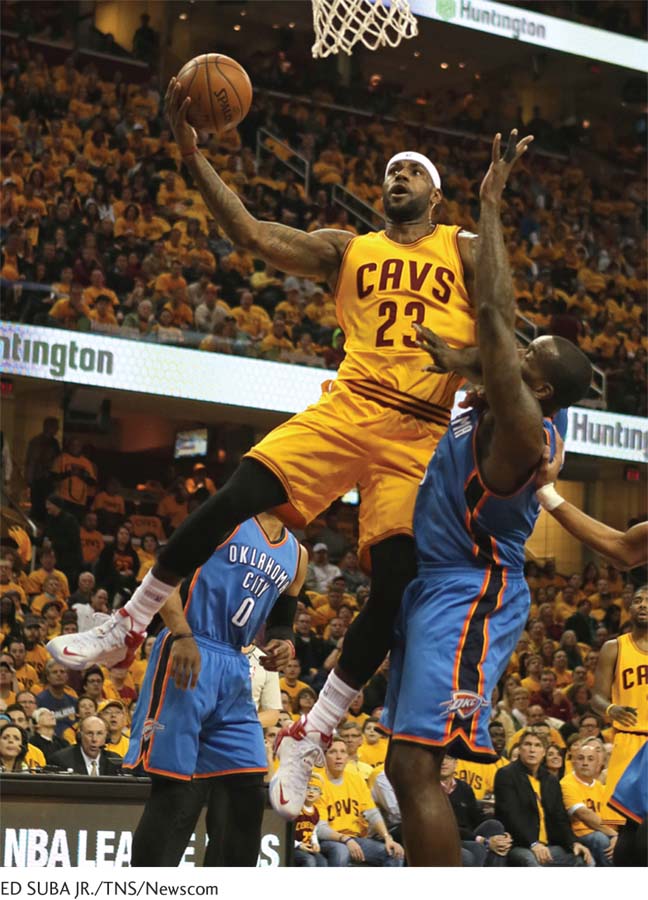
Does LeBron James have a “hot hand”? Studies of baseball, basketball, and many other sports tell the same story: You may feel as if you have a “hot hand,” but the pattern is only a strongly felt illusion. In basketball, the success or failure of a previous shot does not influence the outcome of the next shot.
ED SUBA JR./TNS/Newscom

You can’t believe everything you think—or feel. Statistically, the “hot hand” in basketball, the “hot seat” at the poker table, and “Big Mo” (momentum) in football are not real; however, they feel real because of hindsight bias and confirmation bias (introduced in Chapter 5). With the possible exception of bowling, “feeling it” does not statistically predict that a “hot streak” will continue (Alter & Oppenheimer, 2006; Gilovich, 1991; Kida, 2006). Nevertheless, basketball players and fans have long believed that a player’s chance of hitting a shot is greater after a make than a miss (Gilovich, Vallone, & Tversky, 1985). However, shooting records of the Philadelphia 76ers, free-throw records from the Boston Celtics, and a controlled study of 14 men and 12 women from Cornell University’s basketball teams all told the same data story. The Cornell athletes, for example, believed that the outcome of the previous shot influenced the next shot even though they did not perform that way (Gilovich et al., 1985).

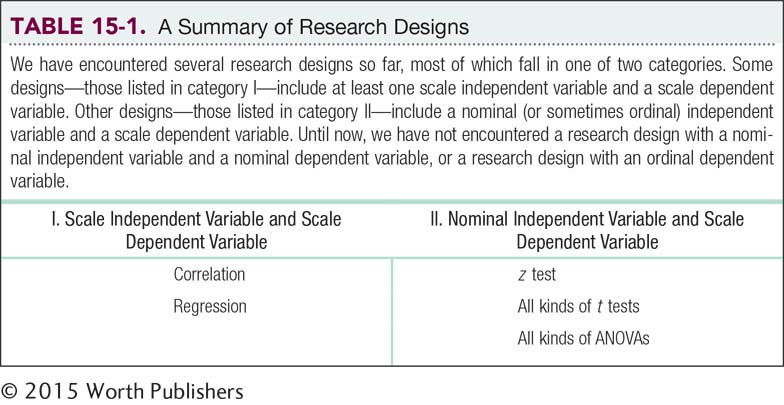
The title of an article by Voss, Federmeier, and Paller (2012), The Potato Chip Really Does Look Like Elvis! reminds us that the brain often tricks us into perceiving patterns that don’t exist. Statistical inference can help us see past our own perceptual biases, separate pattern from chance, and decide whether or not what we have perceived is real—even when the data do not have a scale dependent variable. Table 15-1 summarizes the parametric tests we’ve learned. This chapter helps us explore hypotheses about nonparametric data by teaching (a) when to use a nonparametric test, (b) how to use two nonparametric tests with nominal data, and (c) how to use two nonparametric tests with ordinal data.

image