Nonparametric Tests

CHAPTER OUTLINE
Introduction
The most commonly used statistical methods for inference ultimately rely on certain distributional assumptions. In regression, it is assumed that the residual variation is Normal. In testing of means, if data are not Normal, there is a presumption that sample sizes are large enough to allow for appropriate application of t-tests and F-tests. In addition, it is assumed that the values taken on by the response variables have clear numerical interpretation.
In practice, of course, no distribution is exactly Normal. Fortunately, our usual methods for inference about population means (the one-sample and two-sample t procedures and analysis of variance) are quite robust. That is, the results of inference are not very sensitive to moderate lack of Normality, especially when the samples are reasonably large. Some practical guidelines for taking advantage of the robustness of these methods appear in Chapter 7. But, with this said, there are applications where the adequacy of standard methods can be seriously challenged:
robustness
- A health care payer, such as Humana or Blue Cross, wants to determine which of five potential benefit plans will appeal to its 10 largest employers.
- Toyota wants to compare the quality of service at a various service locations based on customer surveys using the following scale and coded responses: 1=very poor, 2=poor, 3=fair, 4=good, and 5=excellent.
- Generac is a leading manufacturer of residential and commercial standby generators. Reliability of its generators is essential to protect consumers from loss and inconvenience during power outages. The number of repairs of generators during the warranty period is typically quite small. Generac wishes to use frequency of repair data across different generator product models to see if there is evidence of different levels of reliability.
What can we do if plots suggest that the population distribution is clearly not Normal, especially when we have only a few observations? This is not a simple question. Here are the basic options:
- If there are extreme outliers in a small data set, any inference method may be suspect. An outlier is an observation that may not come from the same population as the others. To decide what to do, you must find the cause of the outlier. Equipment failure that produced a bad measurement, for example, entitles you to remove the outlier and analyze the remaining data. If the outlier appears to be “real data,” it is risky to draw any conclusion from just a few observations.
- Sometimes we can transform our data so that their distribution is more nearly Normal. Transformations such as the logarithm that pull in the long tail of right-skewed distributions are particularly helpful. Exercises 7.112 (page 413) and 11.8 (page 538) illustrate the use of the logarithm transformation.
- In some settings, other standard distributions replace the Normal distributions as models for the overall pattern in the population. There are inference procedures for the parameters of these distributions that replace the t procedures when we use specific non-Normal models.
- Finally, there are inference procedures that do not require any specific form for the distribution of the population. These are called nonparametric methods. The sign test and the runs test are examples of nonparametric tests that have been earlier covered.

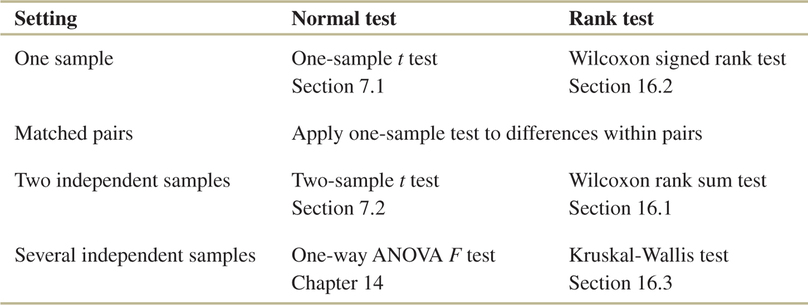
This chapter concerns rank tests that are designed to replace the t tests and one-way analysis of variance when the Normality conditions for those tests are not met. Figure 16.1 presents an outline of the standard tests (based on Normal distributions) and the rank tests that compete with them.
The rank tests we study concern the center of a population or populations. When a population has at least roughly a Normal distribution, we describe its center by the mean. The “Normal tests” in Figure 16.1 test hypotheses about population means. When distributions are strongly skewed, we often prefer the median to the mean as a measure of center. In simplest form, the hypotheses for rank tests just replace mean by median.
We devote a section of this chapter to each of the rank procedures. Section 16.1, which discusses the most common of these tests, also contains general information about rank tests. The kind of assumptions required, the nature of the hypotheses tested, the big idea of using ranks, and the contrast between exact distributions for use with small samples and approximations for use with larger samples are common to all rank tests. Sections 16.2 and 16.3 more briefly describe other rank tests.