PART II REVIEW
PART II REVIEW
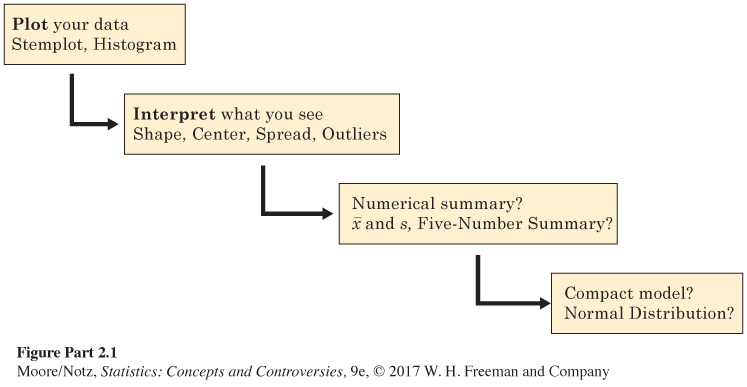
Data analysis is the art of describing data using graphs and numerical summaries. The purpose of data analysis is to help us see and understand the most important features of a set of data. Chapter 10 commented on basic graphs, especially pie charts, bar graphs, and line graphs. Chapters 11, 12, and 13 showed how data analysis works by presenting statistical ideas and tools for describing the distribution of one variable. Figure II.1 organizes the big ideas. We plot our data, then describe their center and spread using either the mean and standard deviation or the five-number summary. The last step, which makes sense only for some data, is to summarize the data in compact form by using a Normal curve as a model for the overall pattern. The question marks at the last two stages remind us that the usefulness of numerical summaries and Normal distributions depends on what we find when we examine graphs of our data. No short summary does justice to irregular shapes or to data with several distinct clusters.
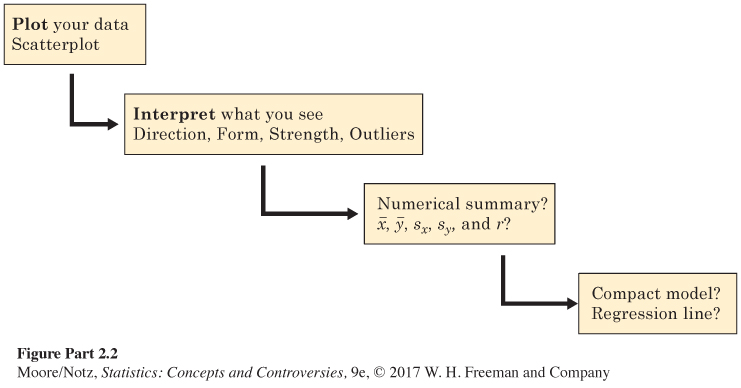
Chapters 14 and 15 applied the same ideas to relationships between two quantitative variables. Figure II.2 retraces the big ideas from Figure II.1, with details that fit the new setting. We always begin by making graphs of our data. In the case of a scatterplot, we have learned a numerical summary only for data that show a roughly straight-line pattern on the scatterplot. The summary is then the means and standard deviations of the two variables and their correlation. A regression line drawn on the plot gives us a compact model of the overall pattern that we can use for prediction. Once again there are question marks at the last two stages to remind us that correlation and regression describe only straight-line relationships.
Relationships often raise the question of causation. We know that evidence from randomized comparative experiments is the “gold standard’’ for deciding that one variable causes changes in another variable. Chapter 15 reminded us in more detail that strong associations can appear in data even when there is no direct causation. We must always think about the possible effects of variables lurking in the background. In Chapter 16, we met a new kind of description, index numbers, with the Consumer Price Index as the leading example. Chapter 16 also discussed government statistical offices, a quiet but important part of the statistical world.