P.6 Trigonometric FunctionsPrinted Page 49
OBJECTIVES
When you finish this section, you should be able to:
1 Work with Properties of Trigonometric FunctionsPrinted Page 49
NEED TO REVIEW?
Trigonometric functions are discussed in Appendix A.4, pp. A-27 to A-35.
Table 5 on page 50 lists the six trigonometric functions and the domain and range of each function.
50
| Function | Symbol | Domain | Range |
|---|---|---|---|
| sine | y=sinx | All real numbers | \{ y|{-}1\leq y\leq 1\} |
| cosine | y=cosx | All real numbers | y|−1≤y≤1 |
| tangent | y=tanx | {x|x≠ odd integer multiples of π2} | All real numbers |
| cosecant | y=cscx | \{{x |x\neq \hbox{ integer multiples of }\pi}\} | \{ y|y\leq -1 \hbox{ or } y\geq 1\} |
| secant | y=secx | {x|x≠ odd integer multiples of π2} | \{ y|y\leq -1 \hbox{ or } y\geq 1\} |
| cotangent | y=cotx | \{{x |x\neq \hbox{ integer multiples of }\pi}\} | All real numbers |
An important property common to all trigonometric functions is that they are periodic.
DEFINITION
A function f is called periodic if there is a positive number p with the property that whenever x is in the domain of f, so is x+p, and \bbox[5px, border:1px solid black, #F9F7ED]{\bbox[#FAF8ED,5pt]{f(x + p) = f(x)}}
If there is a smallest number p with this property, it is called the ( fundamental) period of f.
The sine, cosine, cosecant, and secant functions are periodic with period 2\pi; the tangent and cotangent functions are periodic with period \pi.
THEOREM Period of Trigonometric Functions
\bbox[5px, border:1px solid black, #F9F7ED]{\bbox[#FAF8ED,5pt]{\bbox[5px, border:1px solid black, #F9F7ED]{\begin{array}{lll} {\rm{sin}}(x + 2\pi ) = \sin x& \cos (x + 2\pi ) = \cos x& \tan (x + \pi ) = \tan x \\ \csc (x + 2\pi ) = \csc x& \sec (x + 2\pi ) = \sec x& \cot (x + \pi ) = \cot x \end{array}}}}
Because the trigonometric functions are periodic, once the values of the function over one period are known, the values over the entire domain are known. This property is useful for graphing trigonometric functions.
The next result, also useful for graphing the trigonometric functions, is a consequence of the even-odd identities, namely, \sin(-x) =-\sin x and \cos (-x) =\cos x. From these, we have \begin{array}{@{\hspace*{-10pt}}rcl@{\hspace*{15pt}}rcl} \tan ( -x)~&=&\dfrac{\sin ( -x) }{\cos ( -x) }=\dfrac{-\sin x}{\cos x}=-\tan x & \sec (-x)~&=&\dfrac{1}{\cos ( -x) }=\dfrac{1}{\cos x}=\sec x \\ \cot ( -x)~&=&\dfrac{1}{\tan ( -x) }=\dfrac{1}{-\tan x} =-\cot x & \csc ( -x)~&=&\dfrac{1}{\sin ( -x) }=\dfrac{1}{-\sin x}=-\csc x \end{array}
THEOREM Even-Odd Properties of the Trigonometric Functions
The sine, tangent, cosecant, and cotangent functions are odd, so their graphs are symmetric with respect to the origin.
The cosine and secant functions are even, so their graphs are symmetric with respect to the y-axis.
2 Graph the Trigonometric FunctionsPrinted Page 50
NEED TO REVIEW?
The values of the trigonometric functions for select numbers are discussed in Appendix A.4, pp. A-29 and A-31.
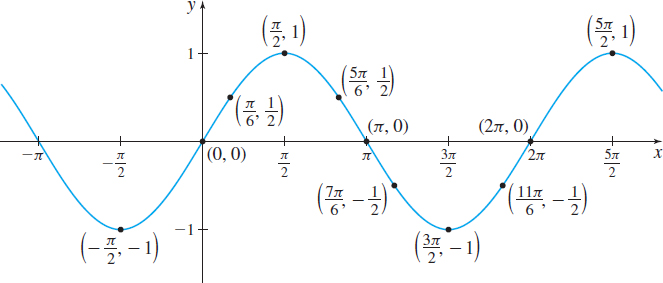
To graph y=\sin x, we use Table 6 to obtain points on the graph. Then we plot some of these points and connect them with a smooth curve. Since the sine function has a period of 2\pi, continue the graph to the left of 0 and to the right of 2\pi. See Figure 70.
51
| x | {y = \sin x} | {(x,y)} |
|---|---|---|
| 0 | 0 | (0,0) |
| \dfrac{\pi }{6} | \dfrac{1}{2} | \left( {\frac{\pi }{{\rm{6}}},\frac{1}{2}} \right) |
| \dfrac{\pi }{2} | 1 | \left(\dfrac{\pi }{2},1\right) |
| \dfrac{5\pi }{6} | \dfrac{1}{2} | \left( \dfrac{5\pi }{6},\dfrac{1}{2}\right) |
| \pi | 0 | (\pi, 0) |
| \dfrac{7\pi }{6} | -\dfrac{1}{2} | \left( \dfrac{7\pi }{6},-\dfrac{1}{2}\right) |
| \dfrac{3\pi}{2} | -1 | \left(\dfrac{3\pi }{2},-1\right) |
| \dfrac{11\pi }{6} | -\dfrac{1}{2} | \left( \dfrac{11\pi }{6},-\dfrac{1}{2}\right) |
| 2\pi | 0 | (2\pi, 0) |
Notice the symmetry of the graph with respect to the origin. This is a consequence of f being an odd function.
The graph of y=\sin x illustrates some facts about the sine function.
Properties of the Sine Function f( x) =\sin x
- The domain of f is the set of all real numbers.
- The range of f consists of all real numbers in the closed interval \left[-1,1\right].
- The sine function is an odd function, so its graph is symmetric with respect to the origin.
- The sine function has a period of 2\pi.
- The x-intercepts of f are \ldots, -2\pi, -\pi, 0, \pi, 2\pi, 3\pi, \ldots; the y-intercept is 0.
- The maximum value of f is 1 and occurs at x=\ldots,-\dfrac{3\pi }{2}, \dfrac{\pi }{2}, \dfrac{5\pi }{2}, \dfrac{9\pi }{2}, \ldots; the minimum value of f is -1 and occurs at x=\ldots, -\dfrac{\pi}{2},\dfrac{3\pi }{2} , \dfrac{7\pi }{2}, \dfrac{11\pi }{2}, \ldots.
The graph of the cosine function is obtained in a similar way. Locate points on the graph of the cosine function f( x) =\cos x for 0\leq x\leq 2\pi. Then connect the points with a smooth curve, and continue the graph to the left of 0 and to the right of 2\pi to obtain the graph of y=\cos x. See Figure 71.
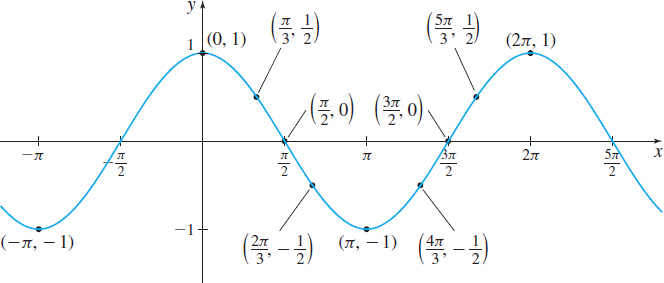
The graph of y=\cos x illustrates some facts about the cosine function.
52
Properties of the Cosine Function f( x) =\cos x
- The domain of f is the set of all real numbers.
- The range of f consists of all real numbers in the closed interval [ -1,1].
- The cosine function is an even function, so its graph is symmetric with respect to the y-axis.
- The cosine function has a period of 2\pi.
- The x-intercepts of f are \ldots, -\dfrac{3\pi }{2}, -\dfrac{\pi }{2}, \dfrac{\pi }{2}, \dfrac{3\pi }{2}, \dfrac{5\pi }{2}, \ldots; the y-intercept is 1.
- The maximum value of f is 1 and occurs at x=\,\ldots ,-2\pi, 0, 2\pi, 4\pi, 6\pi , \ldots; the minimum value of f is -1 and occurs at x= \ldots,-\pi, \pi, 3\pi, 5\pi , \ldots.
Many variations of the sine and cosine functions can be graphed using transformations.
EXAMPLE 1Graphing Variations of {f( x) =\sin x} Using Transformations
Use the graph of f( x) =\sin x to graph g( x) =2~\sin x.
Solution Notice that g(x) =2f( x), so the graph of g is a vertical stretch of the graph of f( x) =\sin x. Figure 72 illustrates the transformation.
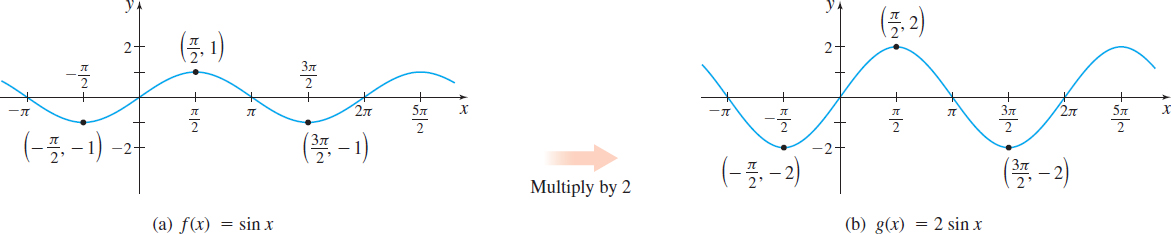


Notice that the values of g( x) =2\sin x lie between -2 and 2, inclusive.
In general, the values of the functions f( x) =A\sin x and g( x) =A\cos x, where A\neq 0, will satisfy the inequalities -\vert A\vert \leq A\sin x\leq \vert A\vert\qquad \hbox{and}\qquad -\vert A\vert \leq A\cos x\leq \vert A\vert respectively. The number \left\vert A\right\vert is called the amplitude of f( x) =A\sin x and of g( x) =A\cos x.
EXAMPLE 2Graphing Variations of {f( x) =\cos x} Using Transformations
Use the graph of f( x) =\cos x to graph g( x) =\cos ( 3x).
Solution The graph of g( x) =\cos ( 3x) is a horizontal compression of the graph of f( x) =\cos x. Figure 73 shows the transformation.
53
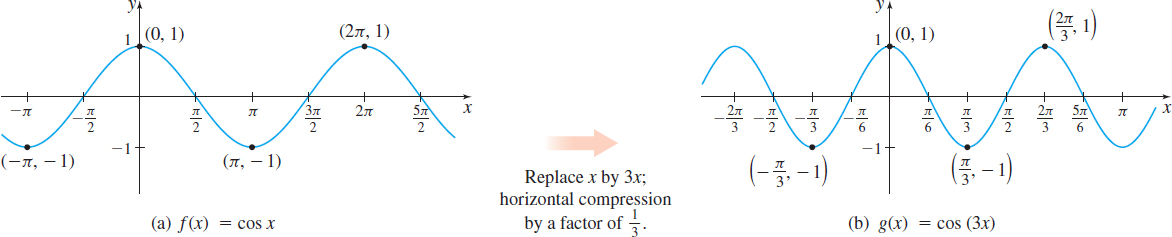
From the graph, we notice that the period of g( x) =\cos (3x) is \dfrac{2\pi }{3}.
NOW WORK
In general, if \omega >0, the functions f( x) =\sin ( \omega x) and g( x) =\cos ( \omega x) have period T=\dfrac{2\pi }{\omega }. If \omega >1, the graphs of f( x) =\sin ( \omega x) and g( x) =\cos (\omega x) are horizontally compressed and the period of the functions is less than 2\pi. If 0<\omega <1, the graphs of f( x) =\sin ( \omega x) and g( x) =\cos (\omega x) are horizontally stretched, and the period of the functions is greater than 2\pi .
One period of the graph of f( x) =\sin ( \omega x) or g( x) =\cos ( \omega x) is called a cycle.
Sinusoidal Graphs
If we shift the graph of the function y=\cos x to the right \dfrac{\pi }{2} units, we obtain the graph of y=\cos \left( x-\dfrac{\pi }{2}\right), as shown in Figure 74(a). Now look at the graph of y=\sin x in Figure 74(b). Notice that the graph of y=\sin x is the same as the graph of y=\cos \left( x-\dfrac{\pi}{2}\!\right).
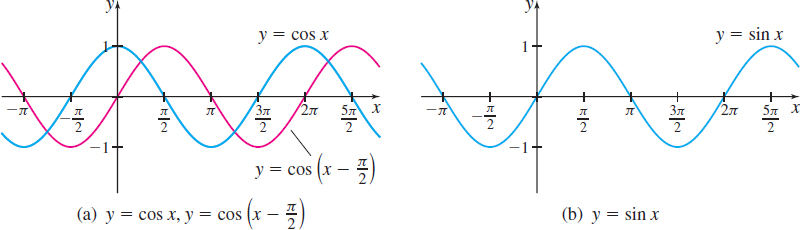
Figure 74 suggests that \begin{equation*}\bbox[#FAF8ED,5pt]{\bbox[5px, border:1px solid black, #F9F7ED]{ \sin x=\cos \left( x-\dfrac{\pi }{2}\!\right) }}\tag{1} \end{equation*}
NEED TO REVIEW?
Trigonometric identities are discussed in Appendix A.4, pp. A-32 to A-35.
Proof
To prove this identity, we use the difference formula for \cos (\alpha -\beta ) with \alpha =x and \beta =\dfrac{\pi }{2}. \cos \, \left( x-\dfrac{\pi }{2}\!\right) =\cos \, x \,\cos \dfrac{\pi }{2}+\sin \, x \, \sin \dfrac{\pi }{2}=\cos \, x\cdot 0+\sin \, x\cdot 1=\sin \, x
54
Because of this relationship, the graphs of y=A\sin ( \omega x) or y=A\cos ( \omega x) are referred to as sinusoidal graphs, and the functions and their variations are called sinusoidal functions.
THEOREM
For the graphs of y=A\sin ( \omega x) and y=A\cos ( \omega x), where A\neq 0 and \omega >0, \bbox[5px, border:1px solid black, #F9F7ED]{\bbox[#FAF8ED,5pt]{ \hbox{Amplitude} =\vert A\vert \qquad \hbox{Period} =T=\dfrac{2\pi }{\omega }}}

EXAMPLE 3Finding the Amplitude and Period of a Sinusoidal Function
Determine the amplitude and period of y=-3\sin ( 4\pi x).
Solution Comparing y=-3\sin (4\pi x) to y = A\sin ( \omega x), we find that A = -3 and \omega = 4\pi. Then, \hbox{Amplitude} =\vert A\vert =\vert {-}3\vert =3 \qquad \hbox{Period} =T=\dfrac{2\pi }{\omega }=\dfrac{2\pi }{4\pi }=\dfrac{1}{2}
NOW WORK
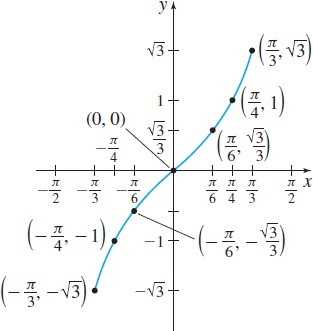
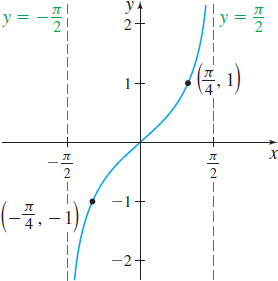
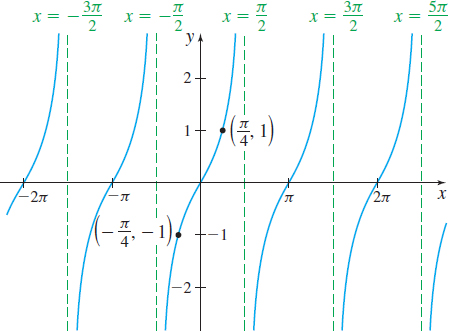
The function y=\tan x is an odd function with period \pi. It is not defined at the odd multiples of \dfrac{\pi }{2}. Do you see why? So, we construct Table 7 for 0\leq x<\dfrac{\pi }{2}. Then we plot the points from Table 7, connect them with a smooth curve, and reflect the graph about the origin, as shown in Figure 75. To investigate the behavior of \tan x near \dfrac{\pi }{2}, we use the identity \tan x=\dfrac{\sin x}{\cos x}. When x is close to, but less than, \dfrac{\pi }{2}, \sin x is close to 1 and \cos x is a positive number close to 0, so the ratio \dfrac{ \sin x}{\cos x} is a large, positive number. The closer x gets to \dfrac{ \pi }{2}, the larger \tan x becomes. Figure 76 shows the graph of y=\tan x, -\dfrac{\pi}{2} < x < \dfrac{\pi}{2}. The complete graph of y=\tan x is obtained by repeating the cycle drawn in Figure 76. See Figure 77.
| x | {y=\tan x} | {( x,y)} |
|---|---|---|
| 0 | 0 | (0, 0) |
| \dfrac{\pi }{6} | \dfrac{\sqrt{3}}{3} | \left( \dfrac{\pi }{6},\dfrac{\sqrt{3}}{3}\!\right) |
| \dfrac{\pi }{4} | 1 | \left( \dfrac{\pi }{4},1\right) |
| \dfrac{\pi }{3} | \sqrt{3} | \left( \dfrac{\pi }{3}, \sqrt{3}\right) |
55
The graph of y=\tan x illustrates the following properties of the tangent function:
Properties of the Tangent Function f( x) =\tan x
- The domain of f is the set of all real numbers, except odd multiples of \dfrac{\pi }{2}.
- The range of f consists of all real numbers.
- The tangent function is an odd function, so its graph is symmetric with respect to the origin.
- The tangent function is periodic with period \pi.
- The x-intercepts of f are \ldots, -2\pi, -\pi, 0, \pi, 2\pi, 3\pi, \ldots; the y-intercept is 0.
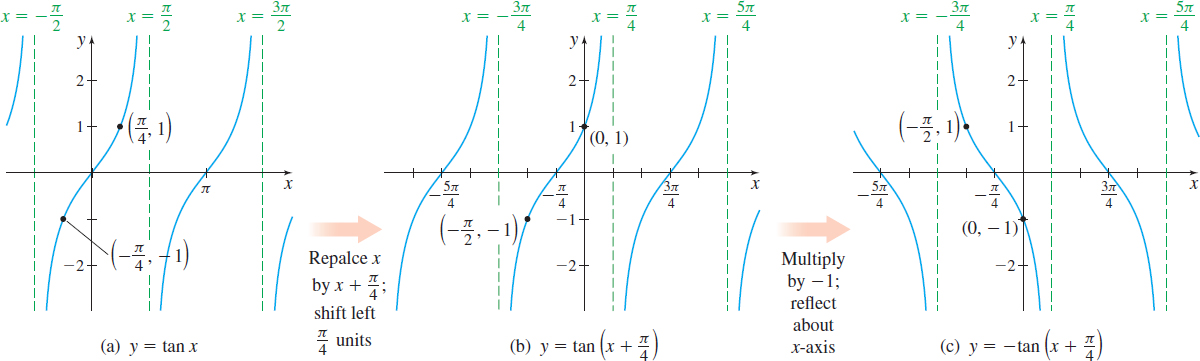
EXAMPLE 4Graphing Variations of {f( x) =\tan x} Using Transformations
Use the graph of f(x) = \tan x to graph g(x) =-\tan\! \left(\! x+\dfrac{\pi }{4}\right).
Solution Figure 78 illustrates the steps used in graphing g( x) =-\tan\! \left(\! x+\dfrac{\pi }{4} \right).
- Begin by graphing f( x) =\tan x. See Figure 78(a).
- Replace the argument x by x+\dfrac{\pi }{4} to obtain y=\tan\! \left(\! x+\dfrac{\pi }{4} \right), which shifts the graph horizontally to the left \dfrac{\pi }{4} unit, as shown in Figure 78(b).
- Multiply \tan\! \left(\! x+\dfrac{\pi }{4} \right) by -1, which reflects the graph about the x-axis, and results in the graph of y =-\tan\! \left(\! x+\dfrac{\pi }{4} \right), as shown in Figure 78(c).
NOW WORK
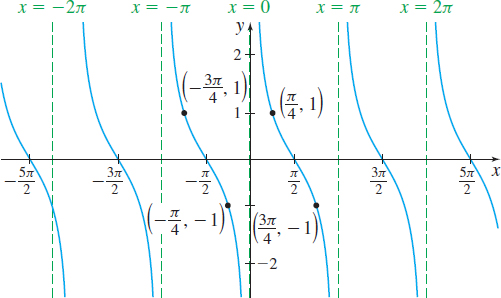
The graph of the cotangent function is obtained similarly. y=\cot x is an odd function, with period \pi. Because \cot x is not defined at integral multiples of \pi, graph y on the interval ( 0,\pi ) and then repeat the graph, as shown in Figure 79.
56
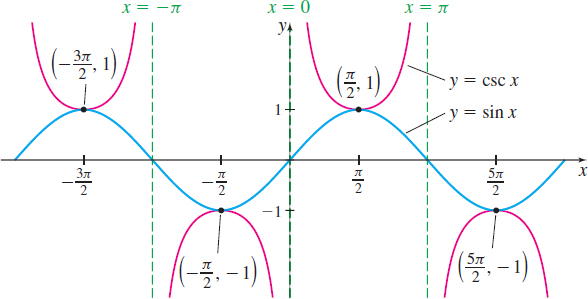
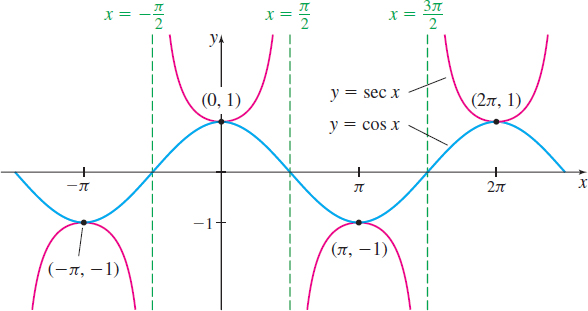
The cosecant and secant functions, sometimes referred to as reciprocal functions, are graphed by using the reciprocal identities \csc x=\dfrac{1}{\sin x} \qquad {\rm and} \qquad \sec x=\dfrac{1}{\cos x}
The graphs of y=\csc x and y=\sec x are shown in Figures 80 and 81, respectively.