17-7 Hertzsprung-Russell (H-R) diagrams reveal different kinds of stars
Astronomers have collected a wealth of data about the stars, but merely having tables of numerical data is not enough. Like all scientists, astronomers want to analyze their data to look for trends and underlying principles. One of the best ways to look for trends in any set of data, whether it comes from astronomy, finance, medicine, or meteorology, is to create a graph showing how one quantity depends on another. For example, investors consult graphs of stock market values versus dates, and weather forecasters make graphs of temperature versus altitude to determine whether thunderstorms are likely to form. Astronomers have found that a particular graph of stellar properties shows that stars fall naturally into just a few categories. This graph, one of the most important in all astronomy, will in later chapters help us understand how stars form, evolve, and eventually die.
H-R Diagrams
A graph of luminosity versus surface temperature reveals that stars fall into a few basic categories
Which properties of stars should we include in a graph? Most stars have about the same chemical composition, but two properties of stars—their luminosities and surface temperatures—differ substantially from one star to another. Stars also come in a wide range of radii, but a star’s radius is a secondary property that can be found from the luminosity and surface temperature (as we saw in Section 17-6 and Box 17-4). We also relegate the positions and space velocities of stars to secondary importance. (In a similar way, a physician is more interested in your weight and blood pressure than in where you live or how fast you drive.) We can then ask the following question: What do we learn when we graph the luminosities of stars versus their surface temperatures?
The first answer to this question was given in 1911 by the Danish astronomer Ejnar Hertzsprung. He pointed out that a regular pattern appears when the absolute magnitudes of stars (which measure their luminosities) are plotted against their colors (which measure their surface temperatures). Two years later, the American astronomer Henry Norris Russell independently discovered a similar regularity in a graph using spectral types (another measure of surface temperature) instead of colors. In recognition of their originators, graphs of this kind are today known as Hertzsprung-Russell diagram, or H-R diagrams (Figure 17-15).
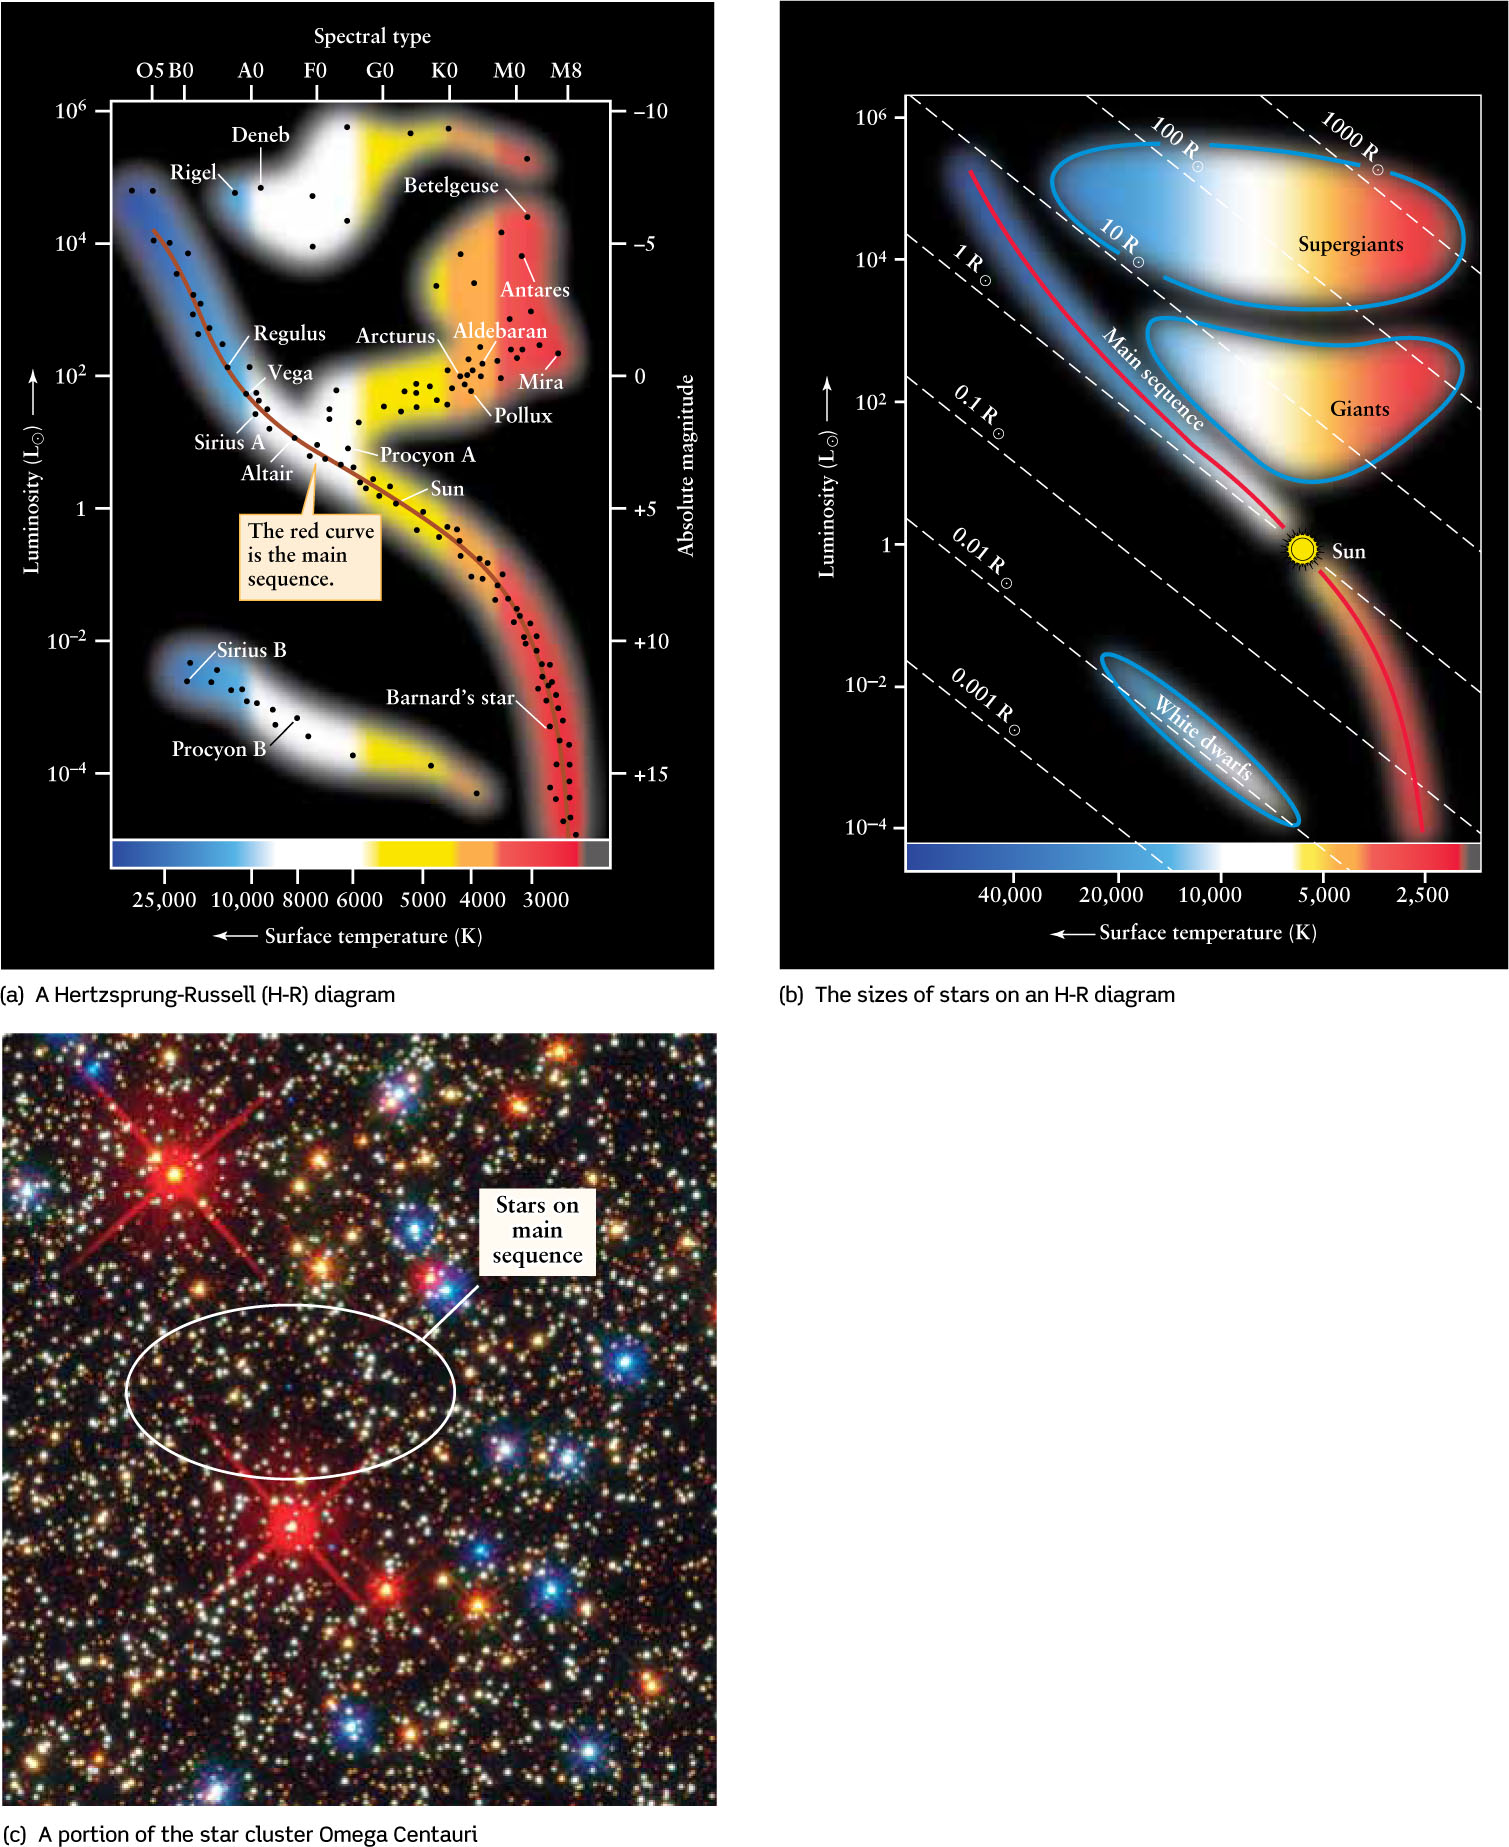
Hertzsprung-Russell (H-R) Diagrams On an H-R diagram, the luminosities (or absolute magnitudes) of stars are plotted against their spectral types (or surface temperatures). (a) The data points are grouped in just a few regions on the graph, showing that luminosity and spectral type are correlated. Most stars lie along the red curve called the main sequence. Giants like Arcturus as well as supergiants like Rigel and Betelgeuse are above the main sequence, and white dwarfs like Sirius B are below it. (b) The blue curves on this H-R diagram enclose the regions of the diagram in which different types of stars are found. The dashed diagonal lines indicate different stellar radii. For a given stellar radius, as the surface temperature increases (that is, moving from right to left in the diagram), the star glows more intensely and the luminosity increases (that is, moving upward in the diagram). Note that the Sun is intermediate in luminosity, surface temperature, and radius. (c) Some stars in Omega Centauri are burning hydrogen in their cores and would appear on the main sequence in an H-R diagram. The orange- and red-colored stars are red giants, and the blue stars have begun burning helium in their cores.
Figure 17-15a is a typical Hertzsprung-Russell diagram. Each dot represents a star whose spectral type and luminosity have been determined. The most luminous stars are near the top of the diagram, the least luminous stars near the bottom. Hot stars of spectral classes O and B are toward the left side of the graph and cool stars of spectral class M are toward the right.
CAUTION!
You are probably accustomed to graphs in which the numbers on the horizontal axis increase as you move to the right. (For example, the business section of a newspaper includes a graph of stock market values versus dates, with later dates to the right of earlier ones.) But on an H-R diagram the temperature scale on the horizontal axis increases toward the left. This practice stems from the original diagrams of Hertzsprung and Russell, who placed hot O stars on the left and cool M stars on the right. This arrangement is a tradition that no one has seriously tried to change.
CONCEPT CHECK 17-13
Where on the H-R diagram are the stars with the greatest luminosity and highest temperatures?
The H-R diagram is plotted as increasing luminosity on the vertical axis and decreasing temperature along the horizontal axis. The stars with the greatest luminosity and the highest temperatures are found in the upper left-hand corner of the H-R diagram.
Star Varieties: Main-Sequence Stars, Giants, Supergiants, White Dwarfs, and Brown Dwarfs
The most striking feature of the H-R diagram is that the data points are not scattered randomly over the graph but are grouped in a few distinct regions. The luminosities and surface temperatures of stars do not have random values; instead, these two quantities are related!
The band stretching diagonally across the H-R diagram includes about 90% of the stars in the night sky. This band, called the main sequence, extends from the hot, luminous, blue stars in the upper left corner of the diagram to the cool, dim, red stars in the lower right corner. A star whose properties place it in this region of an H-R diagram is called a main-sequence star. The Sun (spectral type G2, luminosity 1 L⊙, absolute magnitude +4.8) is such a star. We will find that all main-sequence stars are like the Sun in that hydrogen fusion—thermonuclear reactions that convert hydrogen into helium (see Section 16-1)—is taking place in their cores:
Main-sequence stars gain their energy through conversion of hydrogen to helium in their cores.
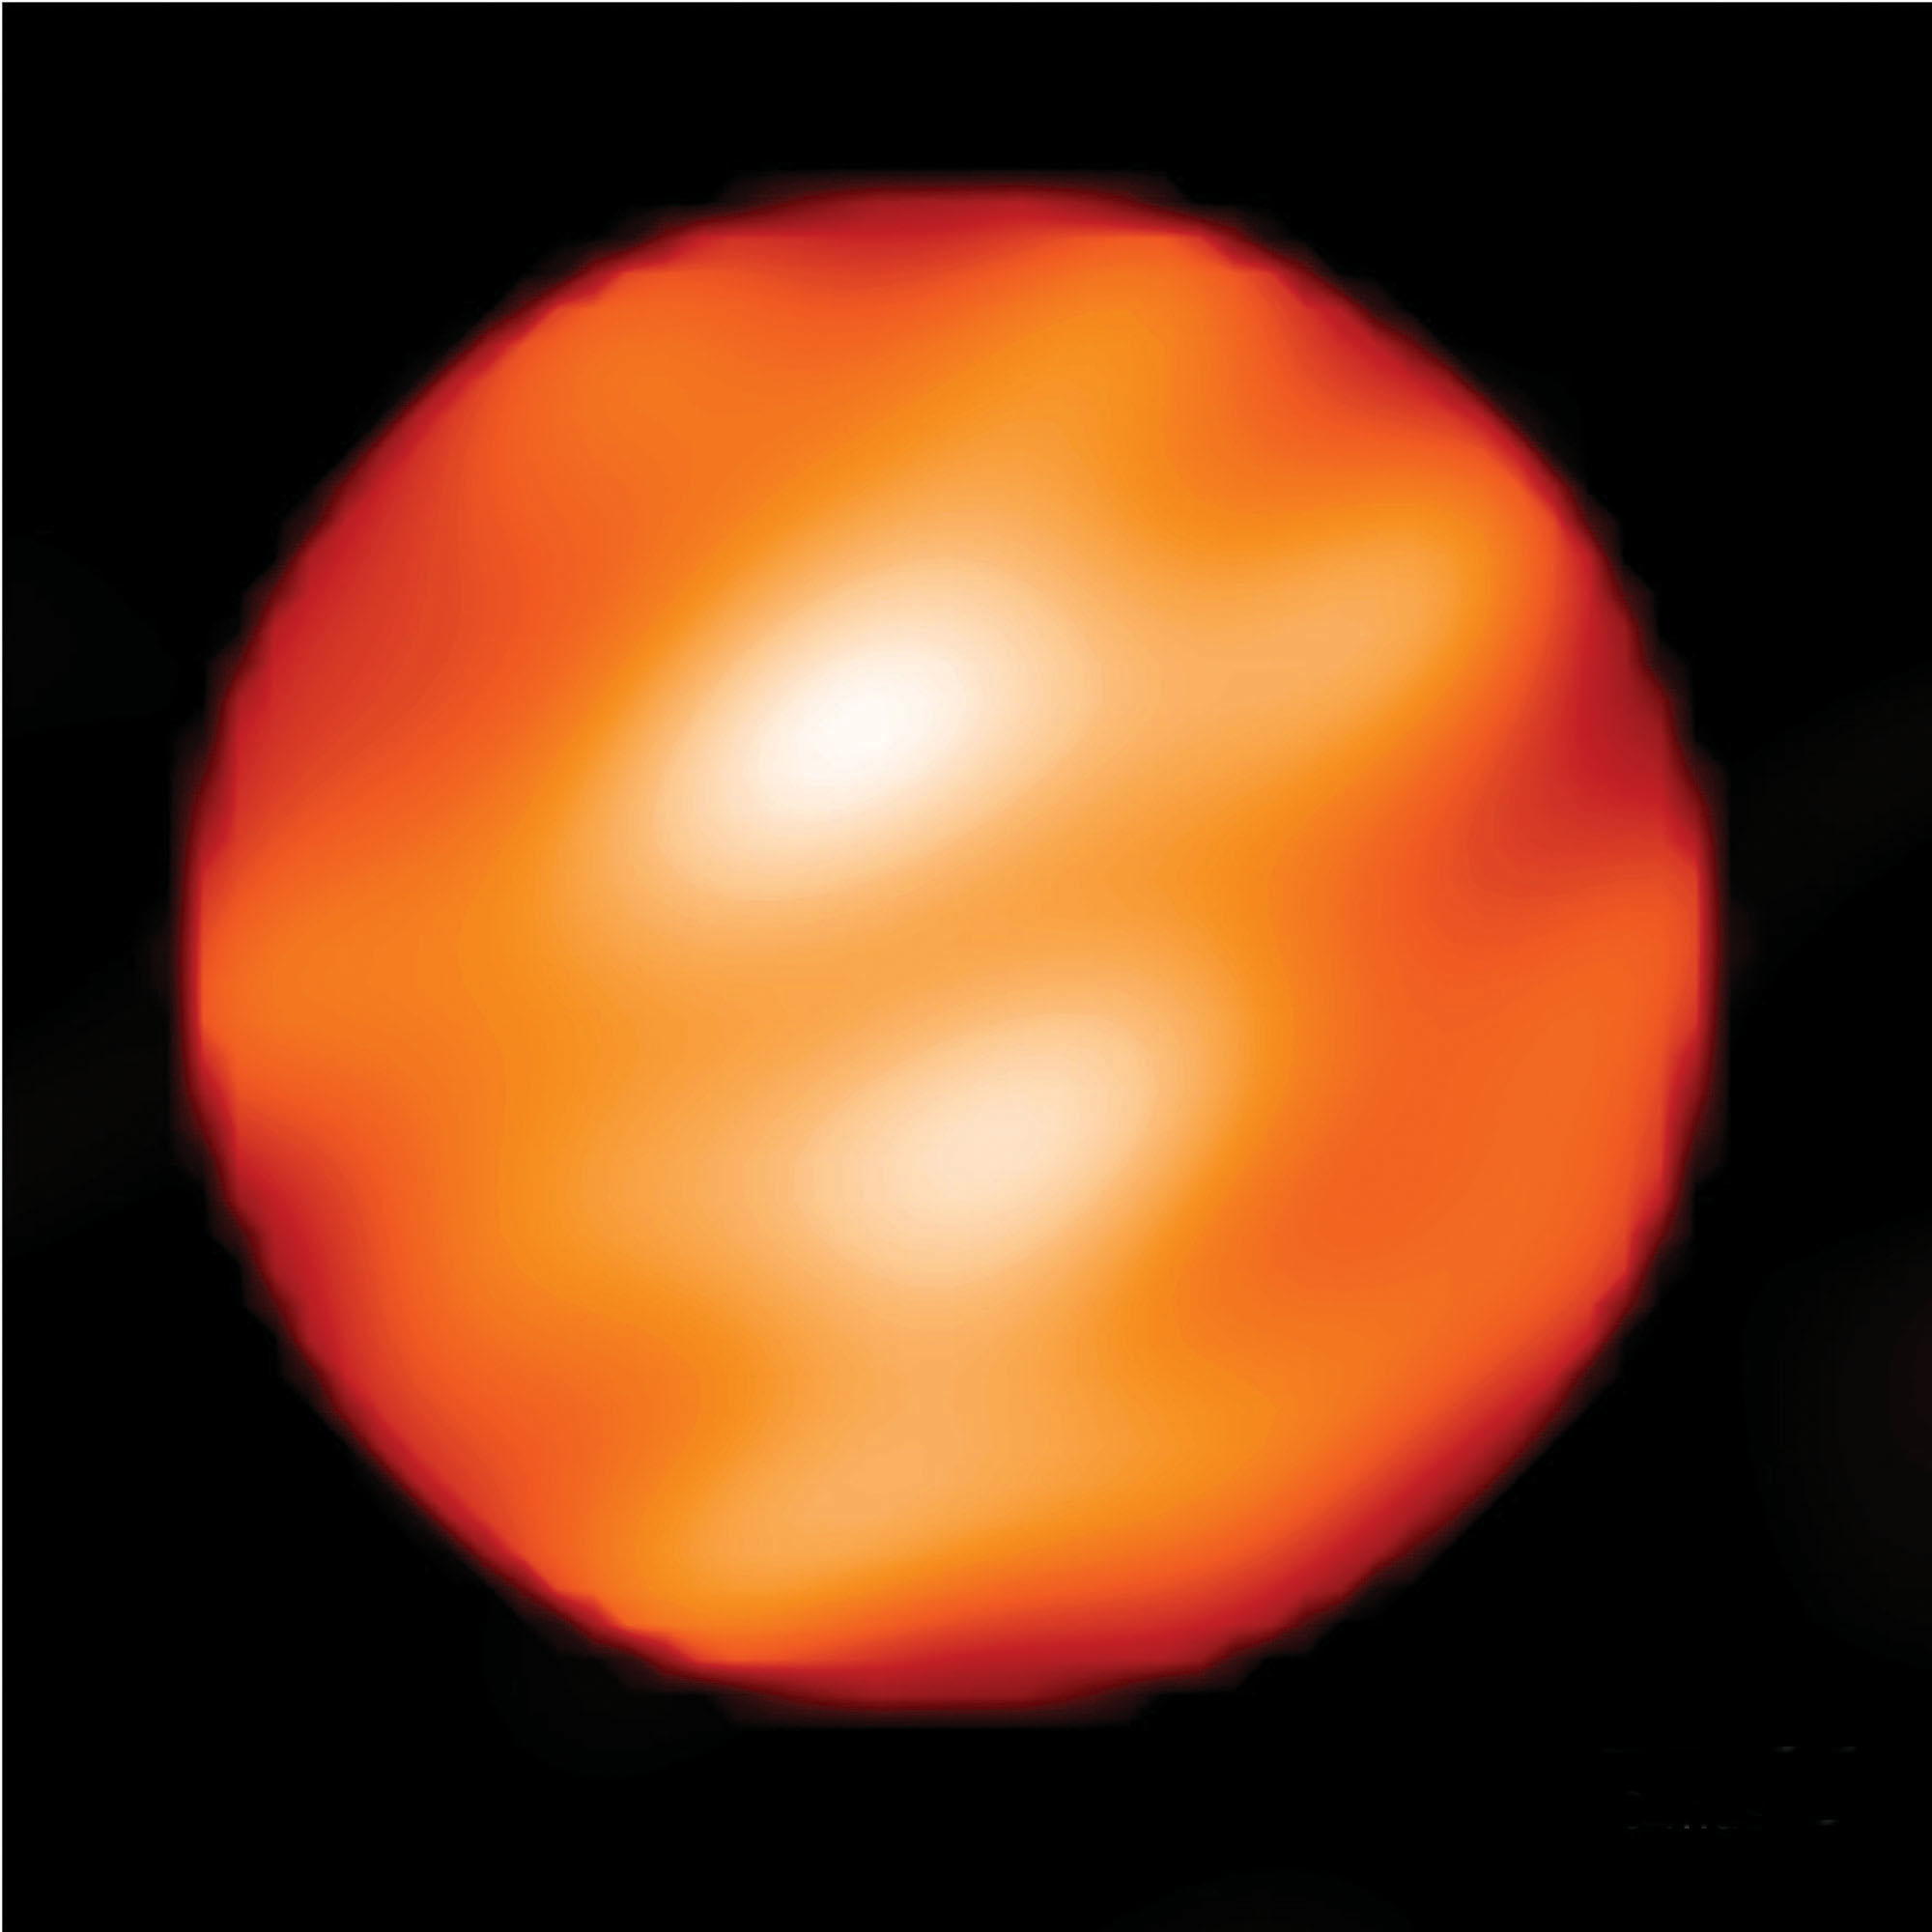
Supergiant Betelgeuse Betelgeuse is just close enough and big enough that its surface features can be reconstructed using special techniques (interferometry at infrared wavelengths). The two brighter regions near the center are thought to be hotter gas rising by convection. The size of Betelgeuse is uncertain because its precise distance from Earth is not known, and its radius changes as the star expands and contracts. In this image, the radius is about 5.5 AU—slightly larger than Jupiter’s orbital distance.
The upper right side of the H-R diagram shows a second major grouping of data points. Stars represented by these points are both luminous and cool. From the Stefan-Boltzmann law, we know that a cool star radiates much less light per unit of surface area than a hot star. In order for these stars to be as luminous as they are, they must be huge (see Section 17-6), and so they are called giants. These stars are about 10 to 100 times larger than the Sun. You can see this size difference in Figure 17-15b, which is an H-R diagram to which dashed lines have been added to represent stellar radii. Most giant stars are around 100 to 1000 times more luminous than the Sun and have surface temperatures of about 3000 to 6000 K. Cooler members of this class of stars (those with surface temperatures from about 3000 to 4000 K) are often called red giants because they appear reddish. In the collection of stars in Figure 17-15c the brightest orange and red stars are red giants. However, while these giant stars also appear larger in this image, their true size is much too small to see; it is really their brightness that overexposes the camera and makes them appear large. (A number of red giants can easily be seen with the naked eye, including Aldebaran in the constellation Taurus and Arcturus in Boötes.)
A few rare stars in the night sky are considerably bigger and brighter than typical red giants, with radii up to 1000 R⊙. Appropriately enough, these superluminous stars are called supergiants. Betelgeuse in Orion (Figure 17-16) and Antares in Scorpius are two supergiants you can find in the nighttime sky. Together, giants and supergiants make up about 1% of the stars in the sky.
Both giants and supergiants have thermonuclear reactions occurring in their interiors, but the character of those reactions and where in the star they occur can be quite different than for a main-sequence star like the Sun. We will study these stars in more detail in Chapter 21.
The remaining 9% of stars in the H-R diagram of Figure 17-15a form a distinct grouping of data points toward the lower left corner. Although these stars are hot, their luminosities are quite low; hence, they must be small. They are appropriately called white dwarfs. These stars, which are so dim that they can be seen only with a telescope, are approximately the same size as Earth. As we will learn in Chapter 20, no thermonuclear reactions take place within white dwarf stars. Rather, like embers left from a fire, they are the still-glowing remnants of what were once giant stars.
By contrast, brown dwarfs (which lie at the extreme lower right of the main sequence, off the bottom and right-hand edge of Figure 17-15a or Figure 17-15b) are objects that will never become stars. They are not massive enough for significant fusing of hydrogen in their cores.
ANALOGY
You can think of white dwarfs as “has-been” stars whose days of glory have passed. In this analogy, a brown dwarf is a “never-will-be” and is sometimes called a “failed star.”
The existence of fundamentally different types of stars is the first important lesson to come from the H-R diagram. In later chapters we will find that these different types represent various stages in the lives of stars. For example, stars can move through the H-R diagram as they leave the main sequence and become red giants. We will use the H-R diagram as an essential tool for understanding how stars evolve.
CONCEPT CHECK 17-14
Betelgeuse and Barnard’s star are both in the red portion of Figure 17-15. What can you deduce about their relative sizes from the H-R diagram?
You can read from the vertical axis of the H-R diagram that Betelgeuse is much more luminous than Barnard’s star. Since they both have similar surface temperatures (around 3500 K), Betelgeuse must be much larger to emit its larger luminosity.
CONCEPT CHECK 17-15
In Figure 17-15, Regulus and Mira are both about 100 times more luminous than our Sun. Which one is powered through conversion of hydrogen to helium in its core?
Regulus. All main-sequence stars, and only these stars (such as Regulus, but not Mira), convert hydrogen to helium in their cores.