17-8 Details of a star’s spectrum reveal whether it is a giant, a white dwarf, or a main-sequence star
A star’s surface temperature largely determines which lines are prominent in its spectrum. Therefore, classifying stars by spectral type is essentially the same as categorizing them by surface temperature. But as the H-R diagram in Figure 17-15b shows, stars of the same surface temperature can have very different luminosities. As an example, a star with surface temperature 5800 K could be a white dwarf, a main-sequence star, a giant, or a supergiant, depending on its luminosity. By examining the details of a star’s spectrum, however, astronomers can determine to which of these categories a star belongs. As we will see, this gives astronomers a tool to determine the distances to stars millions of parsecs away, far beyond the maximum distance that can be measured using stellar parallax.
Determining a Star’s Size from Its Spectrum
The smaller a star and the denser its atmosphere, the broader the absorption lines in its spectrum
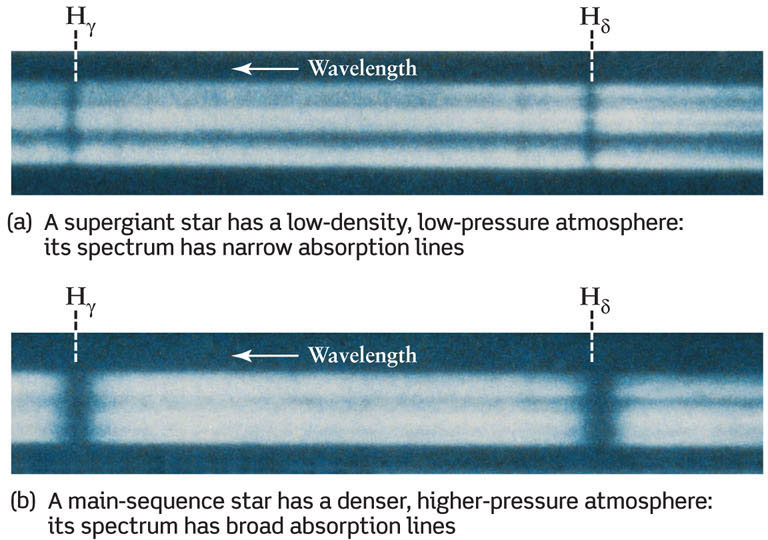
Figure 17-17 compares the spectra of two stars of the same spectral type but different luminosity (and hence different size): a B8 supergiant and a B8 main-sequence star. Note that the Balmer lines of hydrogen are narrow in the spectrum of the very large, very luminous supergiant but are quite broad in the spectrum of the small, less luminous main-sequence star. In general, for stars of spectral types B through F, the larger and more luminous the star, the narrower its hydrogen lines.

How a Star’s Size Affects Its Spectrum These are the spectra of two stars of the same spectral type (B8) and surface temperature (13,400 K) but different radii and luminosities: (a) the B8 supergiant Rigel (luminosity 58,000 L⊙) in Orion, and (b) the B8 main-sequence star Algol (luminosity 100 L⊙) in Perseus.
Fundamentally, these differences between stars of different luminosity are due to differences between the stars’ atmospheres, where absorption lines are produced. Hydrogen lines in particular are affected by the density and pressure of the gas in a star’s atmosphere. The higher the density and pressure, the more frequently hydrogen atoms collide and interact with other atoms and ions in the atmosphere. These collisions shift the energy levels in the hydrogen atoms and thus broaden the hydrogen spectral lines.
In the atmosphere of a luminous giant star, the density and pressure are quite low because the star’s mass is spread over a huge volume. Atoms and ions in the atmosphere are relatively far apart; hence, collisions between them are sufficiently infrequent that hydrogen atoms can produce narrow Balmer lines. A main-sequence star, however, is much more compact than a giant or supergiant. In the denser atmosphere of a main-sequence star, frequent interatomic collisions perturb the energy levels in the hydrogen atoms, thereby producing broader Balmer lines.
Luminosity Classes

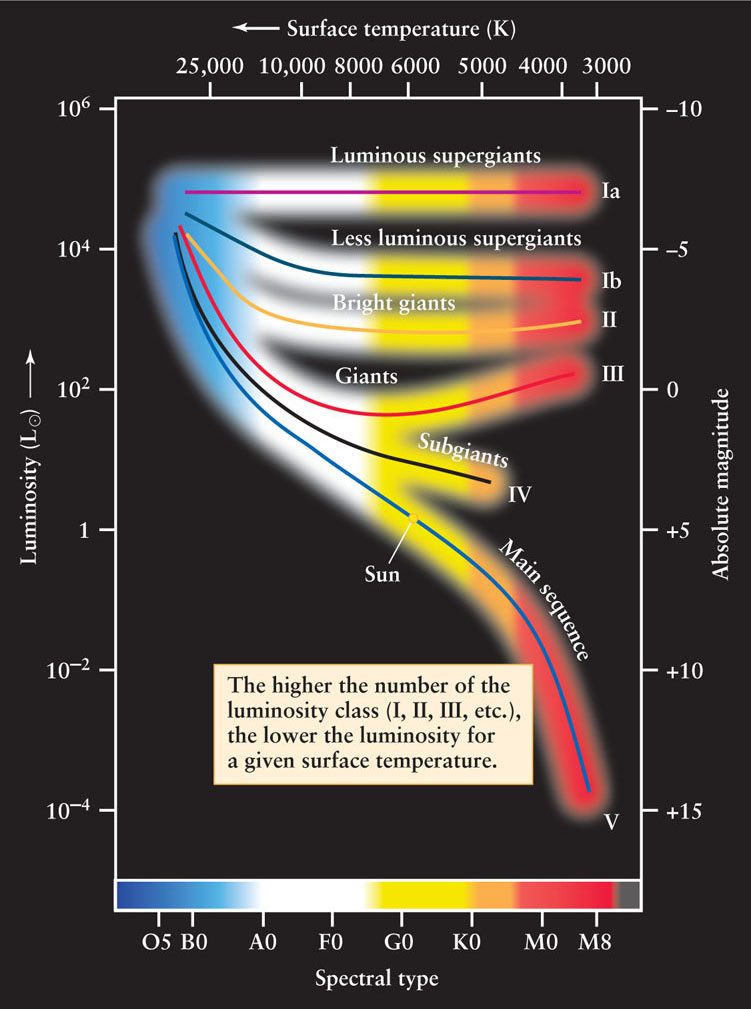
In the 1930s, W. W. Morgan and P. C. Keenan of the Yerkes Observatory of the University of Chicago developed a system of luminosity classes based upon the subtle differences in spectral lines. When these luminosity classes are plotted on an H-R diagram (Figure 17-18), they provide a useful subdivision of the star types in the upper right of the diagram. Luminosity classes Ia and Ib are composed of supergiants; luminosity class V includes all the main-sequence stars. The intermediate classes distinguish giant stars of various luminosities. Note that for stars of a given surface temperature (that is, a given spectral type), the higher the number of the luminosity class, the lower the star’s luminosity.
As we will see in Chapters 19 and 20, different luminosity classes represent different stages in the evolution of a star. White dwarfs are not always given a luminosity class of their own; as we mentioned in Section 17-7, they represent a final stage in stellar evolution in which no thermonuclear reactions take place.
Astronomers commonly use a shorthand description that combines a star’s spectral type and its luminosity class. For example, the Sun is said to be a G2 V star. The spectral type indicates the star’s surface temperature, and the luminosity class indicates its luminosity. Thus, an astronomer knows immediately that any G2 V star is a main-sequence star with a luminosity of about 1 L⊙ and a surface temperature of about 5800 K. Similarly, a description of Aldebaran as a K5 III star tells an astronomer that it is a red giant with a luminosity of around 370 L⊙ and a surface temperature of about 4000 K.
Spectroscopic Parallax
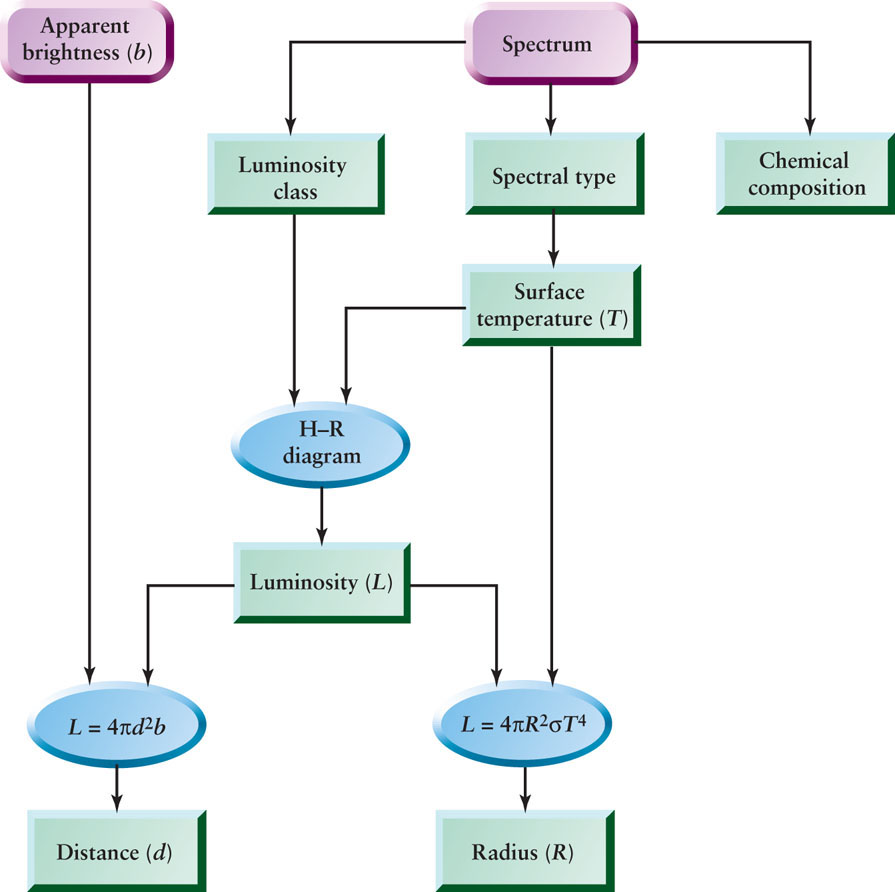
A star’s spectral type and luminosity class, combined with the information on the H-R diagram, enable astronomers to estimate the star’s distance from Earth. As an example, consider the star Pleione in the constellation Taurus. Its spectrum reveals Pleione to be a B8 V star (a hot, blue, main-sequence star, like the one in Figure 17-16b). Using Figure 17-17, we can read off that such a star’s luminosity is 190 L⊙. Given the star’s luminosity and its apparent brightness—in the case of Pleione, 3.9 × 10⁻¹³ of the apparent brightness of the Sun—we can use the inverse-square law to determine its distance from Earth. The mathematical details are worked out in Box 17-2.
This method for determining distance, in which the luminosity of a star is found using spectroscopy, is called spectroscopic parallax. Figure 17-19 summarizes the method of spectroscopic parallax.

CAUTION!
The term “spectroscopic parallax” is a bit misleading, because no parallax angle is involved! The idea is that measuring the star’s spectrum takes the place of measuring its parallax as a way to find the star’s distance. A better name for this method, although not the one used by astronomers, would be “spectroscopic distance determination.”
Spectroscopic parallax is an incredibly powerful technique. No matter how remote a star is, this technique allows astronomers to determine its distance, provided only that its spectrum and apparent brightness can be measured. Box 17-2 gives an example of how spectroscopic parallax has been used to find the distance to stars in other galaxies tens of millions of parsecs away. By contrast, we saw in Section 17-1 that “real” stellar parallaxes can be measured only for stars within a few hundred parsecs.
Unfortunately, spectroscopic parallax has its limitations; distances to individual stars determined using this method often have errors greater than 10%. The reason is that the luminosity classes shown in Figure 17-17 are not thin lines on the H-R diagram but are moderately broad bands. Hence, even if a star’s spectral type and luminosity class are known, there is still some uncertainty in the luminosity that we read off an H-R diagram. Nonetheless, spectroscopic parallax is often the only means that an astronomer has to estimate the distance to remote stars.
What has been left out of this discussion is why different stars have different spectral types and luminosities. One key factor, as we shall see, turns out to be the mass of the star.
CONCEPT CHECK 17-16
What is the luminosity class of the main sequence (see Figure 17-18)? Are all stars in this luminosity class less luminous than the stars in luminosity class III?
The main sequence and all its stars have luminosity class V. At higher temperatures, the main-sequence stars can have a greater luminosity than the lower-temperature stars in luminosity class III.
CONCEPT CHECK 17-17
How does a K5 V star compare to a K5 II star in terms of temperature, luminosity, and radius?
Main-sequence stars are luminosity class “V” whereas luminosity class “II” are giant stars. In this instance, the two stars have the same temperature because they are in the same spectral class, but the luminosity class II star is larger and has a greater luminosity than the much smaller main-sequence star.