9-7 A burgeoning human population is profoundly altering Earth’s biosphere
Global warming and its consequences pose a major challenge to our civilization
One of the extraordinary characteristics of Earth is that it is covered with life, from the floors of the oceans to the tops of mountains and from frigid polar caps to blistering deserts. So far in this chapter we have hinted at how our planet and living organisms interact: The greenhouse effect has given Earth a suitable temperature for the evolution of life (Section 9-1), and over billions of years that evolution has transformed the chemical composition of the atmosphere (Section 9-5). Let’s explore in greater depth how Earth and the organisms that live on it, especially humans, affect each other.
The Biosphere and Natural Climate Variation
All life on Earth subsists in a relatively thin layer called the biosphere, which includes the land, the oceans, the crust a kilometer beneath our feet, and the stratosphere 30 km overhead where microbes have been found. Figure 9-26 is a portrait of Earth’s biosphere based on NASA satellite data. The biosphere, which has taken billions of years to evolve to its present state, is a delicate, highly complex system in which plants and animals depend on each other for their mutual survival.
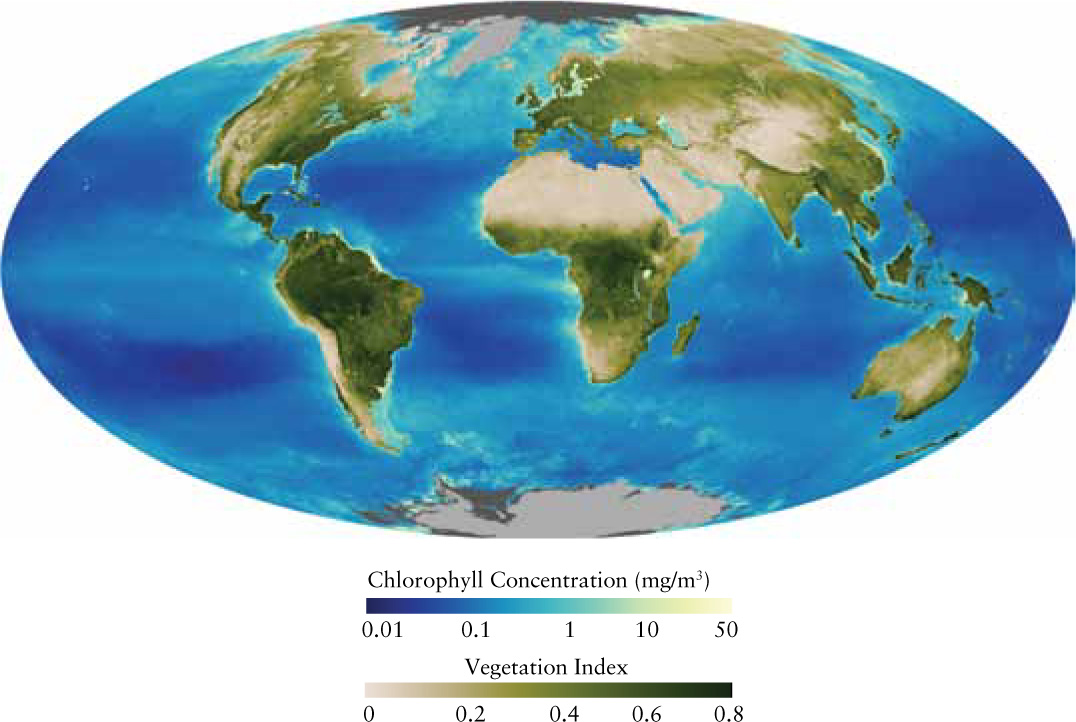
The state of the biosphere depends crucially on the temperatures of the oceans and atmosphere. Even small temperature changes can have dramatic consequences. An example that recurs every three to seven years is the El Niño phenomenon, in which temperatures at the surface of the equatorial Pacific Ocean rise by 2 to 3°C. Ordinarily, water from the cold depths of the ocean is able to well upward, bringing with it nutrients that are used by microscopic marine organisms called phytoplankton that live near the surface (see Figure 9-26). But during an El Niño, the warm surface water suppresses this upwelling, and the phytoplankton starve. This wreaks havoc on organisms such as mollusks that feed on phytoplankton, on the fish that feed on the mollusks, and on the birds and mammals that eat the fish. During the 1982–1983 El Niño, one-quarter of the adult sea lions off the Peruvian coast starved, along with all of their pups.
Many different factors can change the surface temperature of our planet. One is that the amount of energy radiated by the Sun can vary up or down by a few tenths of a percent. Reduced solar brightness may explain the period from 1450 to 1850, when European winters were substantially colder than they are today.
Even the gravitational influences of the Moon and the planets can affect the extent of ice that covers Earth. Thanks to these astronomical influences, the eccentricity of Earth’s orbit varies with a period of 90,000 to 100,000 years, the tilt of its rotation axis varies between 22.1° and 24.5° with a 40,000-year period, and the orientation of its rotation axis changes due to precession (see Section 2-6) with a 26,000-year period. These effects can reinforce or cancel each other and lead to variations called Milankovitch cycles.
The Milankovitch cycles affect the prevalence of glaciers by altering the seasonal contrast between winter (when glaciers grow) and summer (when glaciers retreat). While incorrectly called ice ages, these times of periodically advancing ice sheets are actually called glacial periods or glaciations. During the most recent glaciation, ice sheets covering what is now the state of Wisconsin were over 3 km thick, and their retreat from North America began only about 10,000 years ago.
As we saw in Section 9-1 and Section 9-5, one of the most important factors affecting global temperatures is the abundance of greenhouse gases such as CO2. Geologic processes can alter this abundance, either by removing CO2 from the atmosphere (as happens when fresh rock is uplifted and exposed to water with CO2 dissolved in it, which then forms carbonate minerals) or by supplying new CO2. From time to time in our planet’s history, natural events have caused dramatic increases in the amount of greenhouse gases in the atmosphere. One such event may have taken place 250 million years ago, when Siberia went through a period of intense volcanic activity. (The evidence for this is a layer of 250 million-year-old solidified lava in Siberia that covers an area about the size of Europe!) The tremendous amounts of CO2 released by this activity could have elevated the global temperature by several degrees. Remarkably, the fossil record reveals that 95% of all species on Earth became extinct at this same time (this is called the Permian extinction).
CONCEPT CHECK 9-10
How can a tiny 3°C increase in ocean surface temperature disrupt the food chain?
A 3°C change in ocean surface temperature is sufficient to starve plankton, the base of the food chain, by preventing cooler, nutrient-rich water from moving to the surface.
Human Effects on the Biosphere: Deforestation
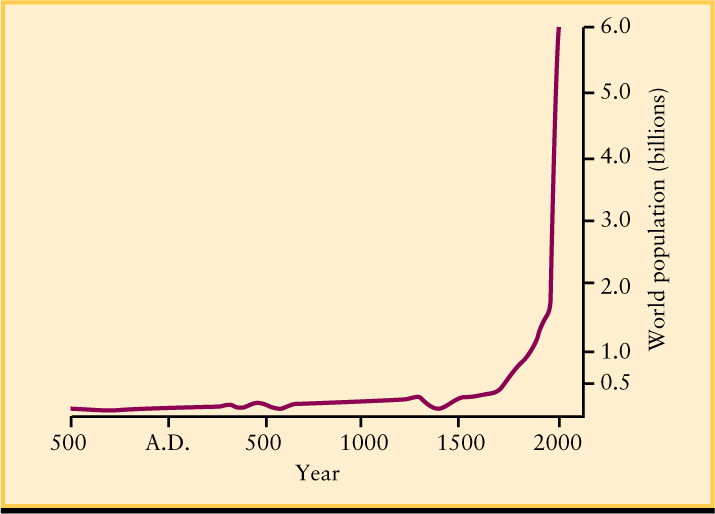
Our species is having an increasing effect on the biosphere because our population is skyrocketing. Figure 9-27 shows the sharp rise in the human population that began in the late 1700s with the Industrial Revolution and the spread of modern ideas about hygiene. This rise accelerated in the twentieth century thanks to medical and technological advances ranging from antibiotics to high-yield grains. In 1960 there were 3 billion people on Earth; in 1975, 4 billion; and in 1999, 6 billion. Projections by the United Nations Population Division show that there will be more than 8 billion people on Earth by the year 2030 and more than 9 billion by 2050.
Every human being has basic requirements: food, clothing, and housing. We all need fuel for cooking and heating. To meet these demands, we burn fossil fuel, cut down forests, and build sprawling cities. A striking example of this activity is occurring in the Amazon rain forest of Brazil. Tropical rain forests are vital to our planet’s ecology because they absorb significant amounts of CO2 and release O2 through photosynthesis. Although rain forests occupy only 7% of the world’s land areas, they are home to at least 50% of all plant and animal species on Earth. Nevertheless, to make way for farms and grazing land, people simply cut down the trees and set them on fire—a process called slash-and-burn. Such deforestation, along with extensive lumbering operations, is occurring in Malaysia, Indonesia, and Papua New Guinea. The rain forests that once thrived in Central America, India, and the western coast of Africa are almost gone (Figure 9-28).
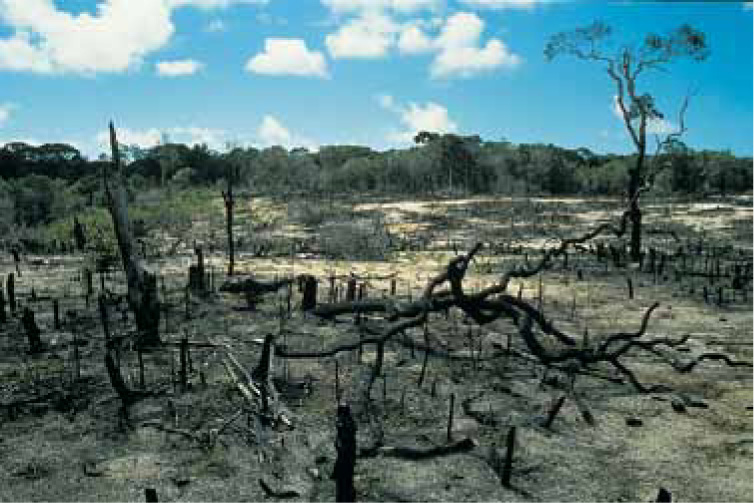
The Deforestation of Amazonia The Amazon, the world’s largest rain forest, is being destroyed at a rate of 20,000 square kilometers per year in order to provide land for grazing and farming and as a source for lumber. About 80% of the logging is being carried out illegally.
CONCEPT CHECK 9-11
In what two ways does deforestation through slash-and-burn increase Earth’s atmospheric carbon dioxide?
Living plants remove CO2 from the atmosphere through photosynthesis, and burning plants release the CO2 they have captured back into the atmosphere.
Human Effects on the Biosphere: The Ozone Layer
Human activity is also having potentially disastrous effects on the upper atmosphere. Certain chemicals released into the air—in particular chlorofluorocarbons (CFCs), which have been used in refrigeration and electronics, and methyl bromide, which is used in fumigation—are destroying the ozone in the stratosphere. We saw in Section 9-6 that ozone molecules absorb ultraviolet radiation from the Sun. Without this high-altitude ozone layer, solar ultraviolet radiation would beat down on Earth’s surface with greatly increased intensity. Such radiation breaks apart most of the delicate molecules that form living tissue. Hence, a complete loss of the ozone layer would lead to a catastrophic ecological disaster.
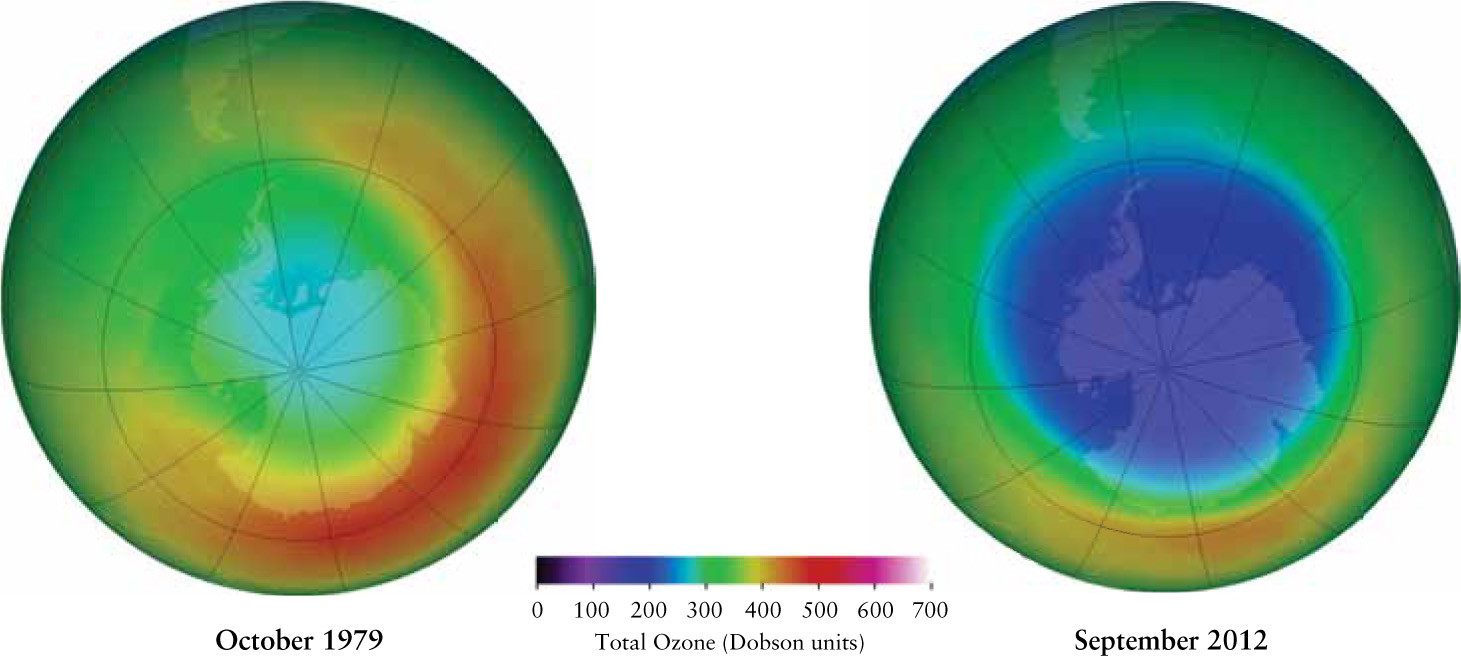
In 1985 scientists discovered an ozone hole, a region with an abnormally low concentration of ozone, over Antarctica. Since then this hole has generally expanded from one year to the next (Figure 9-29). Smaller but still serious effects have been observed in the stratosphere above other parts of Earth. As a result, there has been a worldwide increase in the number of deaths due to skin cancer caused by solar ultraviolet radiation. By international agreement, CFCs are being replaced by compounds that do not deplete stratospheric ozone, and sunlight naturally produces more ozone in the stratosphere. But even in the best of circumstances, the damage to the ozone layer is not expected to heal for many decades.
CONCEPT CHECK 9-12
If ozone is not actually leaking out of the ozone hole, what is moving through this hole?
Atmospheric ozone prevents much of the Sun’s harmful ultraviolet light from entering Earth’s atmosphere. The ozone hole is a region allowing more ultraviolet light to enter Earth’s atmosphere.
Human Effects on the Biosphere: Global Warming and Climate Change
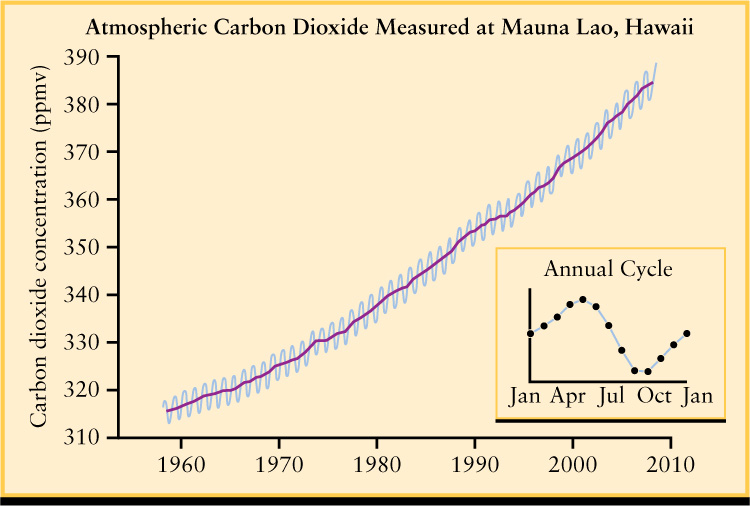
The most troubling influence of human affairs on the biosphere is a consequence of burning fossil fuels (natural gas, petroleum, and coal) in automobiles, airplanes, and power plants as well as burning forests and brushland for agriculture and cooking (Figure 9-28). This burning releases carbon dioxide into Earth’s atmosphere—and we are now adding CO2 to the atmosphere faster than plants and geological processes can extract it. Figure 9-30 shows how the carbon dioxide content of the atmosphere has increased since 1958, when scientists began to measure this quantity on an ongoing basis.
To put the values shown in Figure 9-30 into perspective, we need to know the atmospheric CO2 concentration in earlier eras. Scientists have learned this by analyzing air bubbles trapped at various depths in the ice that blankets the Antarctic and Greenland. Each winter a new ice layer is deposited, so the depth of a bubble indicates the year in which it was trapped. Figure 9-31 uses data obtained in this way to show how the atmospheric CO2 concentration has varied since 1000 c.e. While there has been some natural variation in the concentration, its value has skyrocketed since the beginning of the Industrial Revolution around 1800. Data from older, deeper bubbles of trapped air show that in the 650,000 years before the Industrial Revolution, the CO2 concentration was never greater than 300 parts per million. The present-day CO2 concentration is greater than this by 25% and has grown to its present elevated level in just over half a century. If there are no changes in our energy consumption habits, by 2050 the atmospheric CO2 concentration will be greater than 600 parts per million.
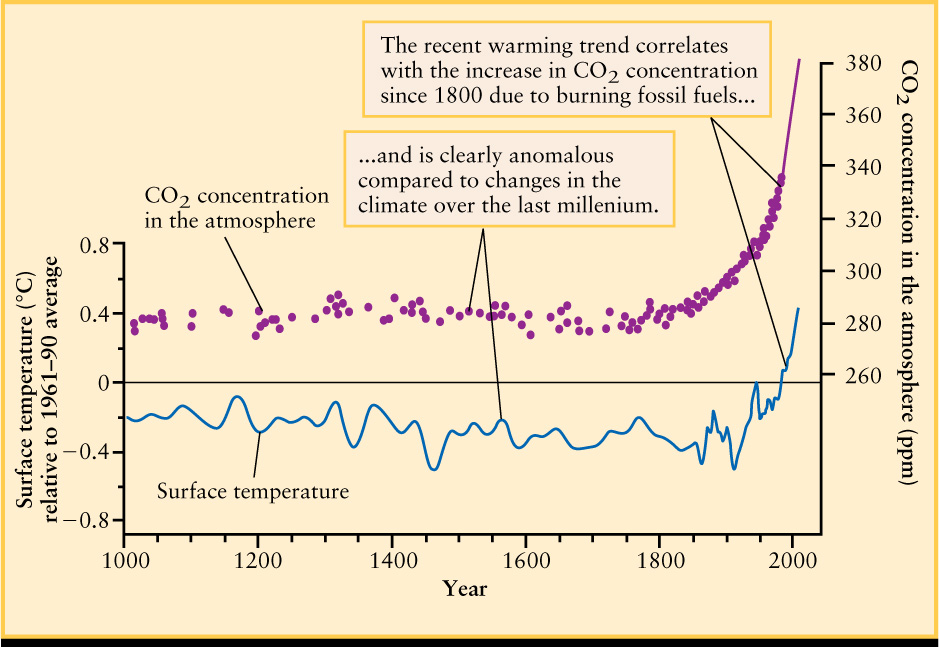
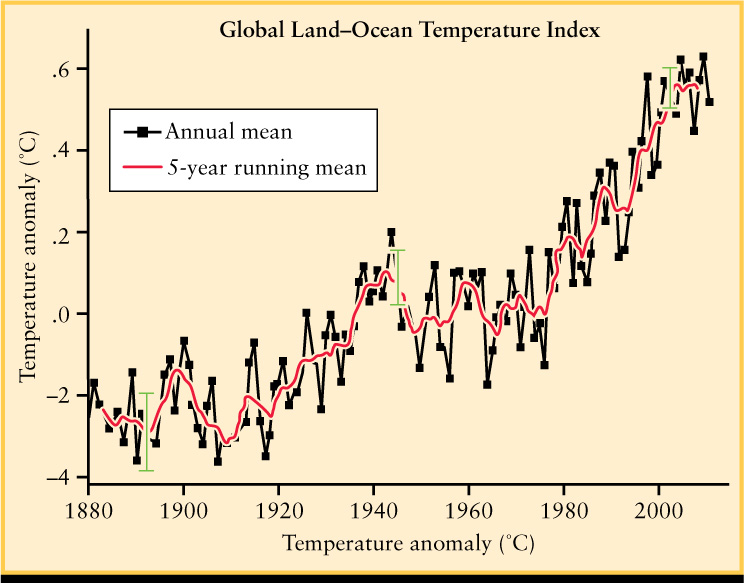
Increasing atmospheric CO2 is of concern because this strengthens the greenhouse effect and raises Earth’s average surface temperature. Figure 9-31 also shows how this average temperature has varied since 1000 c.e. (Like the CO2 data, the temperature data from past centuries comes from analyzing trapped air bubbles. Scientists measure the relative amounts of two different types of atmospheric oxygen called 16O and 18O, described in Box 5-5, in a bubble. The ratio of these is a sensitive measure of the temperature at that time the air was trapped inside the ice.) The recent dramatic increase in atmospheric CO2 concentration has produced an equally dramatic increase in the average surface temperature (Figure 9-32). This temperature increase is called global warming. Other explanations for global warming have been proposed, such as changes in the Sun’s brightness, but only greenhouse gases produced by human activity can explain the steep temperature increase shown in Figure 9-31.
CONCEPT CHECK 9-13
Is the greenhouse effect the same as global warming?
No. Our planet’s natural greenhouse effect has kept the planet warm for billions of years. Global warming refers to the sudden and significant rise in temperatures since the 1800s.
CONCEPT CHECK 9-14
As shown in Figure 9-32, the average temperature from about 2002 to 2010 did not rise. Are these recent measurements consistent with a long-term rise in temperatures?
Yes. As can be seen in Figure 9-32, global temperatures do not rise every single year, or every decade, and global warming refers to the overall rising trend since the 1800s.
Impact of Global Warming
The effects of global warming can be seen around the world. Glaciers worldwide are receding, the area of sea ice cover around the north pole has decreased by 20% since 1979, and a portion of the Antarctic ice shelf has broken off (Figure 9-33).
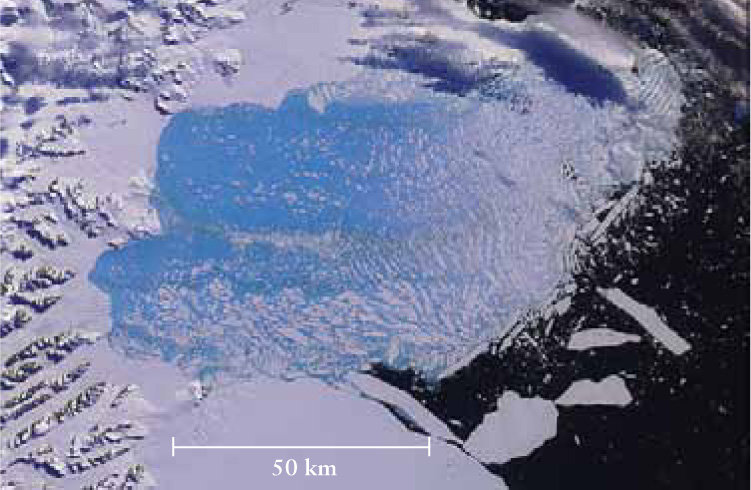
A Melting Antarctic Ice Shelf Global warming caused the Larsen B ice shelf to break up in early 2002. This ice shelf, which was about the size of Rhode Island, is thought to have been part of the Antarctic coast for the past 12,000 years.
Unfortunately, global warming is predicted to intensify in the decades to come. The UN Intergovernmental Panel on Climate Change predicts that if nothing is done to decrease the rate at which we add greenhouse gases to our atmosphere, the average surface temperature will continue to rise by an additional 2 to 4°C during the twenty-first century. What is worse, the temperature increase is predicted to be greater at the poles than at the equator. The global pattern of atmospheric circulation (Figure 9-25) depends on the temperature difference between the warm equator and cold poles, so this entire pattern will be affected. The same is true for the circulation patterns in the oceans. As a result, temperatures will rise in some regions and decline in others, and the patterns of rainfall will be substantially altered. Agriculture depends on rainfall, so these changes in rainfall patterns can cause major disruptions in the world food supply. Studies suggest that the climate changes caused by a 3°C increase in the average surface temperature could cause a worldwide drop in wheat and corn crops of 20 to 400 million tons, putting hundreds of millions of people at risk of hunger.
The melting of polar ice due to global warming poses an additional risk to our civilization. When floating ice like that found near the north pole melts, the ocean level remains the same. (You can see this by examining a glass of water with an ice cube floating in it. The water level does not change when the ice melts.) But the ocean level rises when ice on land melts and runs off into the sea. The Greenland ice cap has been melting at an accelerating rate since 2000 and has the potential to raise sea levels by half a meter or more. Low-lying coastal communities such as Boston and New Orleans, as well as river cities such as London, will have a greater risk of catastrophic flooding. Some island nations of the Pacific will disappear completely beneath the waves.
While global warming is an unintended consequence of human activity, the solution to global warming will require concerted and thoughtful action. Global warming cannot be stopped completely: Even if we were to immediately halt all production of greenhouse gases, the average surface temperature would increase due to existing CO2 still working its way through Earth’s climate system. Instead, our goal is to minimize the effects of global warming by changing the ways in which we produce and use energy. Confronting global warming is perhaps the greatest challenge to face our civilization in the twenty-first century.