A.3 Analytic Geometry Used in CalculusPrinted Page A-16
A-16
OBJECTIVES
When you finish this section, you should be able to:
1 Use the Distance FormulaPrinted Page A-16
Any point \(P\) in the \(xy\)-plane can be located using an ordered pair \(( x, y)\) of real numbers. The ordered pair \((x, y)\), called the coordinates of \(P\), gives enough information to locate the point \(P\) in the plane. For example, to locate the point with coordinates \(( -3,1) \), move \(3\) units along the \(x\) -axis to the left of \(O,\) and then move straight up \(1\) unit. Then plot the point by placing a dot at this location. See Figure 20 in which the points with coordinates \(( -3,1) \),\( (-2,-3) \), \( ( 3,-2) \), and \(( 3,2)\) are plotted.
NOTE
If \((x, y)\) are the coordinates of a point \(P\), then \(x\) is called the \(x\)-coordinate , of \(P\) and \(y\) is called the \(y\)-coordinate , of \(P\).
THEOREM Distance Formula
The distance between two points \(P_{1}=( x_{1}, y_{1}) \) and \(P_{2}=( x_{2}, y_{2}) \), denoted by \(d( P_{1}, P_{1}) \), is \[\bbox[5px, border:1px solid black, #F9F7ED]{\bbox[#FAF8ED,5pt]{ d ( P_{1}, P_{2}) =\displaystyle\sqrt{ ( x_{2}-x_{1}) ^{2}+ ( y_{2}-y_{1}) ^{2}} }} \]
EXAMPLE 1Using the Distance Formula
Find the distance \(d\) between the points \(( -3,5)\) and \(( 3,2) .\)
Solution We use the distance formula with \(P_{1}= ( x_{1}, y_{1}) =( -3,5) \) and \(P_{2}= ( x_{2}, y_{2}) =( 3,2) .\) \[ d=\displaystyle\sqrt{ [ 3-( -3) ] ^{2}+( 2-5) ^{2}}=\displaystyle\sqrt{ 6^{2}+( -3) ^{2}}=\displaystyle\sqrt{36+9}=\displaystyle\sqrt{45}=3\displaystyle\sqrt{5}\approx 6.708 \]
2 Graph Equations, Find Intercepts, and Test for SymmetryPrinted Page A-16
An equation in two variables, say, \(x\) and \(y\), is a statement in which two expressions involving \(x\) and \(y\) are equal. The expressions are called the sides of the equation. Since an equation is a statement, it may be true or false, depending on the value of the variables. Any values of \(x\) and \(y\) that result in a true statement are said to satisfy the equation.
For example, the following are equations in two variables \(x\) and \(y\): \[ \begin{array}[t]{lllllll} x^{2}+y^{2}=5 & {\rm \ \ \ } & 2x-y=6 & {\rm \ \ \ } & y=2x+5 & {\rm \ \ \ } & x^{2}=y \end{array} \]
The equation, \(x^{2}+y^{2}=5\) is satisfied for \(x=1\) and \(y=2\), since \( 1^{2}\,{+}\,2^{2}=1\,{+}\,4=5\). Other choices of \(x\) and \(y\), such as \(x=-1\) and \(y=-2\), also satisfy this equation. It is not satisfied for \(x=2\) and \(y=3\), since \( 2^{2}+3^{2}=4+9=13\neq 5\).
The graph of an equation in two variables \(x\) and \(y\) consists of the set of points in the \(xy\)-plane whose coordinates \(( x, y) \) satisfy the equation.
EXAMPLE 2Graphing an Equation by Plotting Points
Graph the equation \(y=x^{2}\).
Solution Table 4 lists several points on the graph. In Figure 21(a) the points are plotted and then they are connected with a smooth curve to obtain the graph (a parabola). Figure 21(b) shows the graph using graphing technology.
A-17

The graphs in Figure 21 do not show all the points whose coordinates \(( x,y)\) satisfy the equation \(y=x^{2}\). For example, the point \(( 6, 36)\) satisfies the equation \(y=x^{2}\), but it is not shown. It is important when graphing to present enough of the graph so that any viewer will “see” the rest of the graph as an obvious continuation of what is actually there.
Table 4
| \({x}\) | \({y}={x^{2}}\) | \({( {x}, {y})}\) |
|---|---|---|
| \(-4\) | \(16\) | \((-4,16)\) |
| \(-3\) | \(9\) | \((-3,9)\) |
| \(-2\) | \(4\) | \((-2,4)\) |
| \(-1\) | \(1\) | \((-1,1)\) |
| \(0\) | \(0\) | \((0,0)\) |
| \(1\) | \(1\) | \((1,1)\) |
| \(2\) | \(4\) | \((2,4)\) |
| \(3\) | \(9\) | \((3,9)\) |
| \(4\) | \(16\) | \((4,16)\) |
The points, if any, at which a graph crosses or touches a coordinate axis are called the intercepts of the graph. See Figure 22. The \(x\)-coordinate of a point where a graph crosses or touches the \(x\)-axis is an \( x\) -intercept. At an \(x\)-intercept, the \( y\)-coordinate equals \( 0.\) The \(y\)-coordinate of a point where a graph crosses or touches the \(y\) -axis is a \( y\)-intercept. At a \(y\)-intercept, the \(x\)-coordinate equals \(0\). When graphing an equation, all its intercepts should be displayed or be easily inferred from the part of the graph that is displayed.
EXAMPLE 3Finding the Intercepts of a Graph
Find the \(x\)-intercept(s) and the \(y\)-intercept(s) of the graph of \( y=x^{2}-4 \).
Solution To find the \(x\)-intercept(s), we let \(y=0\) and solve the equation \[ \begin{array}{rl@{{16pt}}l} x^{2}-4=0 & & \\[3pt] ( x+2) ( x-2) =0 & & {\color{#0066A7}{\hbox{Factor.}}} \\[3pt] x=-2{\rm \quad or \quad } x=2 & & {\color{#0066A7}{\hbox{Set each factor equal to 0 and solve.}}} \end{array} \]
The equation has two solutions, \(-2\) and \(2\). The \(x\)-intercepts are \(-2\) and \(2\).
To find the \(y\)-intercept(s), we let \(x=0\) in the equation. \[ y=0^{2}-4=-4 \]
The \(y\)-intercept is \(-4\).
DEFINITION Symmetry
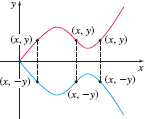
- A graph is symmetric with respect to the \({x }\) -axis if, for every point \(( x, y)\) on the graph, the point \(( x,-y)\) is also on the graph. See Figure 23.
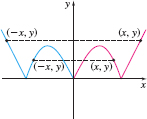
- A graph is symmetric with respect to the \({y }\) -axis if, for every point \(( x, y)\) on the graph, the point \(( -x, y)\) is also on the graph. See Figure 24.
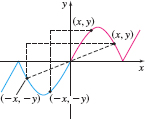
- A graph is symmetric with respect to the origin if, for every point \(( x, y)\) on the graph, the point \(( -x,-y)\) is also on the graph. See Figure 25.
A-18
EXAMPLE 4Testing for Symmetry
Test the graph of \(y=\dfrac{4x^{2}}{x^{2}+1}\) for symmetry.
Solution \(x\)-axis: To test for symmetry with respect to the \( x \)-axis, we replace \(y\) with \(-y\). Since \(-y=\dfrac{4x^{2}}{x^{2}+1}\) is not equivalent to \(y=\dfrac{4x^{2}}{x^{2}+1}\), the graph of the equation is not symmetric with respect to the \(x\)-axis.
\(y\)-axis: To test for symmetry with respect to the \(y\)-axis, we replace \(x\) with \(-x\). Since \(y=\dfrac{4( -x) ^{2}}{( -x) ^{2}+1}= \dfrac{4x^{2}}{x^{2}+1}\) is equivalent to \(y=\dfrac{4x^{2}}{x^{2}+1}\), the graph of the equation is symmetric with respect to the \(y\)-axis.
Origin: To test for symmetry with respect to the origin, we replace \(x\) with \( -x\) and \(y\) with \(-y\). \begin{eqnarray*} -y &=&\dfrac{4( -x) ^{2}}{( -x) ^{2}+1}\quad{\color{#0066A7}{\hbox{Replace x by -x and y by -y.}}} \\[1pt] -y &=&\dfrac{4x^{2}}{x^{2}+1}\quad {\color{#0066A7}{\hbox{Simplify.}}} \\[1pt] y &=&-\dfrac{4x^{2}}{x^{2}+1}\quad{\color{#0066A7}{\hbox{Multiply both sides by -1.}}} \end{eqnarray*}
Since the result is not equivalent to the original equation, the graph of the equation is not symmetric with respect to the origin.
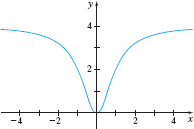
Figure 26 shows the graph of \(y=\dfrac{4x^{2}}{x^{2}+1}\) and confirms the symmetry with respect to the \(y\)-axis.
3 Work with Equations of a LinePrinted Page A-18
DEFINITION Slope
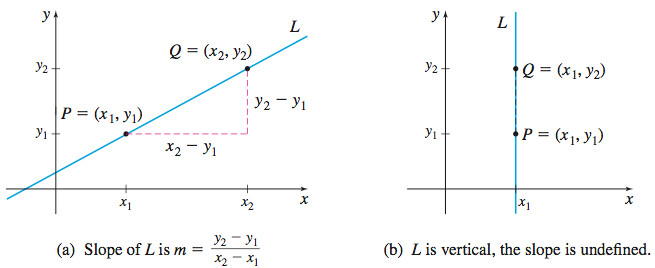
Let \(P= ( x_{1}, y_{1})\) and \(Q= ( x_{2}, y_{2})\) be two distinct points. If \(x_{1}\,{\neq}\,x_{2}\), the slope \(m\) of the nonvertical line \(L\) containing \(P\) and \(Q\) is defined by the formula \[\bbox[5px, border:1px solid black, #F9F7ED]{\bbox[#FAF8ED,5pt]{ m=\dfrac{y_{2}-y_{1}}{x_{2}-x_{1}} \qquad x_{1}\neq x_{2} }} \]
If \(x_{1}=x_{2}\), then \(L\) is a vertical line and the slope \(m\) of \(L\) is undefined.
Figure 27(a) provides an illustration of the slope of a nonvertical line; Figure 27(b) illustrates a vertical line.
From the definition of slope, we conclude:
- When the slope of a line is positive, the line slants upward from left to right.
- When the slope of a line is negative, the line slants downward from left to right.
A-19
- When the slope of a line is \(0\), the line is horizontal.
- When the slope of a line is undefined, the line is vertical.
THEOREM Equation of a Vertical Line
A vertical line is given by an equation of the form \[\bbox[5px, border:1px solid black, #F9F7ED]{\bbox[#FAF8ED,5pt]{ x=a}} \] where \(a\) is the \(x\)-intercept.
THEOREM Point-Slope Form of an Equation of a Line
An equation of a nonvertical line with slope \(m\) that contains the point\( ( x_{1},y_{1})\) is \[\bbox[5px, border:1px solid black, #F9F7ED]{\bbox[#FAF8ED,5pt]{ y-y_{1}=m\,( x-x_{1}) }}\]
EXAMPLE 5Using the Point-Slope Form of a Line
An equation of the line with slope \(4\) and containing the point \(( 1,2)\) can be found by using the point-slope form with \(m=4\), \(x_{1}=1\), and \(y_{1}=2\). \[ \begin{array}{lrcll@{{16pt}}ll} & y-y_{1}&=&m( x-x_{1}) & & {\color{#0066A7}{\hbox{Point-slope form of a line}}} & \\[3pt] & y-2&=&4( x-1) & & {\color{#0066A7}{{m=4}\hbox{, }{x}_{1}{=1} \hbox{, }{y}_{1}{=2}}} & \\[3pt] \,\ \ \ \ \ \ \ \ \ \ \ \ \ \ \ \ \ & ~\ \ \ \ \ y&=&4x-2 & & {\color{#0066A7}{\hbox{ Solve for }{y.}}} & \hbox{ } \end{array} \]
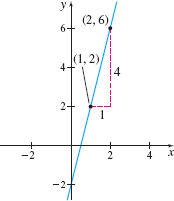
See Figure 28 for the graph of \(y\).
Another useful equation of a line is obtained when the slope \(m\) and the \(y\)-intercept \(b\) are known. The point-slope form is used to obtain the following equation of a line with slope \(m\), containing the point \((0,b) \): \[ y-b=m ( x-0)\qquad \hbox{ or equivalently }\qquad y=mx+b \]
THEOREM Slope-Intercept Form of an Equation of a Line
An equation of a line with slope \(m\) and \(y\)-intercept \(b\) is \[\bbox[5px, border:1px solid black, #F9F7ED]{\bbox[#FAF8ED,5pt]{ y=mx+b }} \]
For a horizontal line, the slope \(m\) is \(0\).
THEOREM Equation of a Horizontal Line
A horizontal line is given by an equation of the form \[\bbox[5px, border:1px solid black, #F9F7ED]{\bbox[#FAF8ED,5pt]{ y=b }} \] where \(b\) is the \(y\)-intercept.
EXAMPLE 6Finding the Slope and y-intercept from an Equation of a Line
Find the slope \(m\) and the \(y\)-intercept of the equation \(2x+4y=8\). Graph the equation.
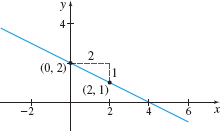
Solution To obtain the slope and \(y\)-intercept, we write the equation in slope-intercept form by solving for \(y\). \begin{eqnarray*} 2x+4y &=&8 \\[3pt] 4y &=&-2x+8 \\[3pt] y &=&-\dfrac{1}{2}x+2 \quad{\color{#0066A7}{y=mx+b}} \end{eqnarray*}
A-20
The coefficient of \(x\) is the slope. The slope is \(-\dfrac{1}{2}.\) The constant \(2\) is the \(y\)-intercept, so the point \(( 0,2)\) is on the graph. Now use the slope \(-\dfrac{1}{2}.\) Starting at the point \(( 0,2)\), we move \(2\) units to the right and then \(1\) unit down to the point \((2, 1)\). We plot this point and draw a line through the two points. See Figure 29.
When two lines in the plane do not intersect, they are parallel.
THEOREM Criterion for Parallel Lines
Two nonvertical lines are parallel if and only if their slopes are equal and they have different \(y\)-intercepts.
EXAMPLE 7Finding an Equation of a Line that Is Parallel to a Given Line
Find an equation of the line that contains the point \((1,2) \) and is parallel to the line \(y=5x\).
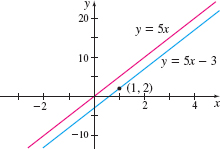
Solution Since the two lines are parallel, the slope of the line we seek equals the slope of the line \(y=5x,\) which is \(5.\) Since the line we seek also contains the point \(( 1,2) \), we use the point-slope form to obtain the equation. \begin{eqnarray*} y-y_{1} &=&m( x-x_{1}) \\[0pt] y-2 &=&5( x-1) \\[0pt] y-2 &=&5x-5 \\[0pt] y &=&5x-3 \end{eqnarray*}
The line \(y=5x-3\) contains the point \(( 1,2)\) and is parallel to the line \(y=5x.\) See Figure 30.
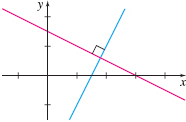
When two lines intersect at a right angle (\(90 {{}^\circ}\)), they are perpendicular. See Figure 31.
THEOREM Criterion for Perpendicular Lines
Two nonvertical lines are perpendicular if and only if the product of their slopes is \(-1.\)
EXAMPLE 8Finding an Equation of a Line that Is Perpendicular to a Given Line
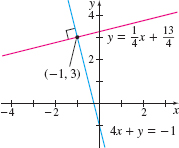
Find an equation of the line that contains the point \(( -1,3)\) and is perpendicular to the line \(4x+y=-1.\)
Solution We begin by writing the equation of the given line in slope-intercept form to find its slope. \begin{eqnarray*} 4x+y &=&-1 \\[0pt] y &=&-4x-1 \end{eqnarray*}
This line has a slope of \(-4.\) Any line perpendicular to this line will have slope \(\dfrac{1}{4}.\) Because the point \( ( -1,3)\) is on this line, we use the point-slope form of a line. \begin{eqnarray*} y-y_{1} &=&m( x-x_{1}) \\[3pt] y-3 &=&\dfrac{1}{4} [ x- ( -1) ] \\[4pt] y-3 &=&\dfrac{1}{4}x+\dfrac{1}{4} \\[4pt] y &=&\dfrac{1}{4}x+\dfrac{13}{4} \end{eqnarray*}
Figure 32 shows the graphs of \(4x+y=-1\) and \(y=\dfrac{1}{4}x+\dfrac{13}{4}\).
4 Work with the Equation of a CirclePrinted Page A-21
A-21
An advantage of a coordinate system is that it enables a geometric statement to be translated into an algebraic statement, and vice versa. Consider, for example, the following geometric statement that defines a circle.
DEFINITION Circle
A circle is the set of points in the \(xy\)-plane that is a fixed distance \(r\) from a fixed point \(( h,\,k) \). The fixed distance \(r\) is called the radius, and the fixed point \(( h,\,k)\) is called the center of the circle.
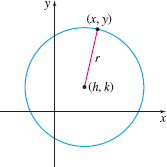
Figure 33 shows the graph of a circle. To find an equation that describes a circle, let \(( x,y)\) represent the coordinates of any point on the circle with radius \(r\) and center \(( h,k) .\) Then the distance between the point \(( x,y)\) and \(( h,k) \) equals \(r\). That is, by the distance formula, \[ \displaystyle\sqrt{( x-h) ^{2}+( y-k) ^{2}}=r \]
Now we square both sides to obtain \[\bbox[5px, border:1px solid black, #F9F7ED]{\bbox[#FAF8ED,5pt]{ ( x-h) ^{2}+( y-k) ^{2}=r^{2} }} \]
This form of the equation of a circle is called the standard form.
THEOREM
The standard form of a circle with radius \(r\) and center at the origin \(( 0,0)\) is \[\bbox[5px, border:1px solid black, #F9F7ED]{\bbox[#FAF8ED,5pt]{ x^{2}+y^{2}=r^{2}} } \]
DEFINITION Unit Circle
The circle with radius \(r=1\) and center at the origin is called the unit circle and has the equation \[\bbox[5px, border:1px solid black, #F9F7ED]{\bbox[#FAF8ED,5pt]{ x^{2}+y^{2}=1 }}\]
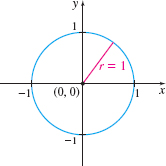
See Figure 34.
EXAMPLE 9Graphing a Circle
Graph the equation \(( x+3) ^{2}+( y-2) ^{2}=16\).
Solution This is the standard form of an equation of a circle. To graph the circle, we first identify the center and the radius of the circle. \begin{eqnarray*} ( x+3) ^{2}+( y-2) ^{2}&=&16\\[0pt] ( x-( \underset{\underset{\color{#0066A7}{h}}{\color{#0066A7}{\uparrow}}}{-3}))^{2} +( y-\underset{\underset{\color{#0066A7}{k}}{\color{#0066A7}{\uparrow}}}{2})^{2}&=&\underset{\underset{\color{#0066A7}{r^2}}{\color{#0066A7}{\uparrow}}}{4^{2}}\\[0pt] \end{eqnarray*}
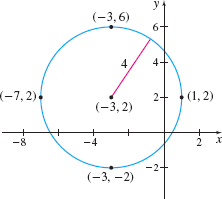
The circle has its center at the point\( ( -3, 2) ;\) its radius is \(4\) units. To graph the circle, we plot the center \(( -3, 2) .\) Then we locate the four points on the circle that are \(4\) units to the left, to the right, above, and below the center. These four points are used as guides to obtain the graph. See Figure 35.
DEFINITION General Form of the Equation of a Circle
The equation \[\bbox[5px, border:1px solid black, #F9F7ED]{\bbox[#FAF8ED,5pt]{ x^{2}+y^{2}+ax+bx+c=0 } }\] is called the general form of the equation of a circle.
A-22
NEED TO REVIEW?
Completing the square is discussed in Section A.1, p. A-2.
If the equation of a circle is given in the general form, we use the method of completing the square to put the equation in standard form in order to identify the center and radius.
EXAMPLE 10Graphing a Circle Whose Equation Is in General Form
Graph the equation \[ x^{2}+y^{2}+4x-6y+12=0 \]
Solution We complete the square in both \(x\) and \(y\) to put the equation in standard form. First, we group the terms involving \(x\), group the terms involving \(y,\) and put the constant on the right side of the equation. The result is \[ ( x^{2}+4x) + ( y^{2}-6y) =-12 \]
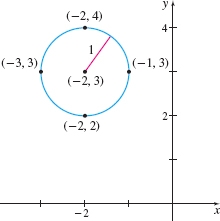
Next, we complete the square of each expression in parentheses. Remember that any number added to the left side of an equation must be added to the right side. \begin{eqnarray*} {( x^{2}+4x\underset{\underset{\color{#0066A7}{\hbox{Add \(\left( \dfrac{4}{2}\right) ^{\!\!\!2}=\, 4\)}}}{\color{#0066A7}{\displaystyle\uparrow}}}{+}4) + ( y^{2}-6y\underset{\underset{\color{#0066A7}{\hbox{Add \(\left( \dfrac{-6}{2}\right) ^{\!\!\!2}=\, 9\)}}} {\color{#0066A7}{\displaystyle \uparrow}}}{+}9) }&=&-12+4+9=1\\ ( x+2)^{2}+( y-3) ^{2}&=&1 {16pt}\quad {\color{#0066A7}{\hbox{Factor.}}} \end{eqnarray*}
This is the standard form of the equation of a circle with radius \(1\) and center at the point \(( -2,3)\). To graph the circle, we plot the center \(( -2,3)\) and points \(1\) unit to the right, to the left, above and below the point \(( -2,3)\), as shown in Figure 36.
5 Graph Parabolas, Ellipses, and HyperbolasPrinted Page A-22
The graph of the equation \(y=x^{2}\) is an example of a parabola. See Figure 21. In fact, every parabola has a shape like the graph of \(y=x^{2}\).
A parabola is the graph of an equation in one of the four forms: \[\bbox[5px, border:1px solid black, #F9F7ED]{\bbox[#FAF8ED,5pt]{ \begin{array}{@{}l@{}} y^{2}=4ax \qquad y^{2}=-4ax\qquad x^{2}=4ay \qquad x^{2}=-4ay \end{array} }} \] where \(a>0\).
In each of the parabolas in Figure 37, the vertex \(V\) is at the origin \((0,0)\). When the equation is of the form \(y^{2}=4ax\), the point \((a,0)\) is called the focus, and the parabola is symmetric with respect to the \(x\)-axis. When the equation is of the form \( x^{2}=4ay\), the point \((0,a)\) is the focus, and the parabola is symmetric with respect to the \(y\)-axis.
A-23
EXAMPLE 11Graphing a Parabola with Vertex at the Origin
Graph the equation \(x^{2}=16y\).
Solution The graph of \(x^{2}=16y\) is a parabola of the form \[ x^{2}=4ay \]
where \(a=4\). Look at Figure 37(c). The graph will open up, with focus at\( ( 0,4) \). The vertex is at \(( 0,0) \). To graph the parabola, we let \(y=a;\) that is, let \(y=4\). (Any other positive number will also work.) \begin{eqnarray*} x^{2} &=&16y \underset{\underset{\color{#0066A7}{\hbox{\(y=a=4\)}}}{\color{#0066A7}{\displaystyle\uparrow }}}{=} 16( 4) =64 \\[-5.6pt] x &=&-8\qquad\hbox{ or }\qquad x=8 \end{eqnarray*}
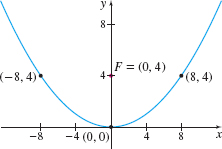
The points\( ( -8,4)\) and\( ( 8,4)\) are on the parabola and establish its opening. See Figure 38.
An ellipse is the graph of an equation in one of the two forms: \[\bbox[5px, border:1px solid black, #F9F7ED]{\bbox[#FAF8ED,5pt]{ \dfrac{x^{2}}{a^{2}}+\dfrac{y^{2}}{b^{2}}=1 \qquad \dfrac{x^{2}}{b^{2}}+\dfrac{y^{2}}{a^{2}}=1 }}\] where \(a\geq b > 0\).
NOTE
If \({a=b}\), then \(\dfrac{{x}^{2}}{ {a}^{2}}{+\dfrac{y^{2}}{a^{2}}=1}\) is the equation of a circle of radius \(a\).
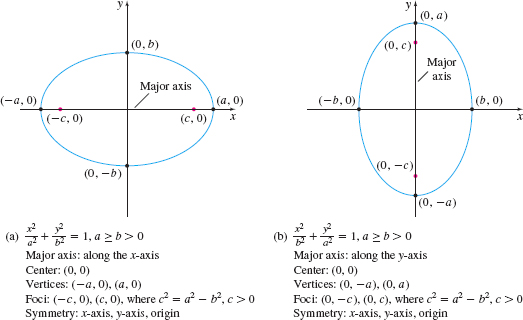
An ellipse is oval-shaped. The line segment dividing the ellipse in half the long way is the major axis; its length is \(2a\). The two points of intersection of the ellipse and the major axis are the vertices of the ellipse. The midpoint of the vertices is the center of the ellipse. The line segment through the center of the ellipse and perpendicular to the major axis is the minor axis. Along the major axis \(c\) units from the center of the ellipse, where \( c^{2}=a^{2}-b^{2},\) \(c > 0,\) are two points, called foci, that determine the shape of the ellipse. See Figure 39.
EXAMPLE 12Graphing an Ellipse with Center at the Origin
Graph the equation: \(9x^{2}+4y^{2}=36\)
Solution To put the equation in standard form, we divide each side by \(36\). \[ \dfrac{x^{2}}{4}+\dfrac{y^{2}}{9}=1 \]
The graph of this equation is an ellipse. Since the larger number is under \( y^{2}\), the major axis is along the \(y\)-axis. The center is at the origin (0, 0). It is easiest to graph an ellipse by finding its intercepts: \[ \begin{array}{rcl@{\qquad\qquad\qquad\qquad}rcl} {x\hbox{-intercepts: Let }y=0} & {y\hbox{-intercepts: Let }x=0} \\[5pt] \dfrac{x^{2}}{4}+\dfrac{0^{2}}{9} &=& 1 & 0^{2}+\dfrac{y^{2}}{9}&=&1 \\[9pt] x^{2}&=&4 & y^{2}&=&9 \\[5pt] {x=-2 \hbox{ and } x=2} & {y=-3 \hbox{ and } y=3} \end{array} \]
A-24
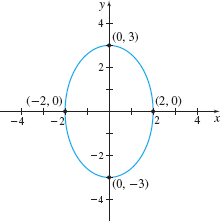
The points \(( -2,0) \), \(( 2,0) \), \(( 0,-3) \) , \(( 0,3)\) are the intercepts of the ellipse. See Figure 40.
A hyperbola is the graph of an equation in one of the two forms: \[\bbox[5px, border:1px solid black, #F9F7ED]{\bbox[#FAF8ED,5pt]{ \dfrac{x^{2}}{a^{2}}-\dfrac{y^{2}}{b^{2}}=1 \qquad \dfrac{y^{2}}{b^{2}}-\dfrac{x^{2}}{a^{2}}=1 }}\] where \(a>0\) and \(b>0\).
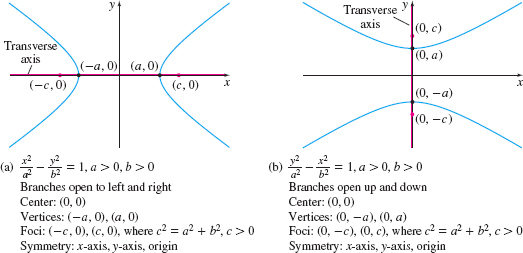
Two points, called foci, determine the shape of the hyperbola. The midpoint of the line segment containing the foci is called the center of the hyperbola. The foci are located \(c\) units from the center, where \(c^{2}=a^{2}+b^{2},\) \(c>0.\) The line containing the foci is called the transverse axis. The vertices of a hyperbola are its intercepts.
See Figure 41. The graph of a hyperbola consists of two branches. For the hyperbola \(\dfrac{ x^{2}}{a^{2}}-\dfrac{y^{2}}{b^{2}}=1,\) the branches of the graph open left and right; for the hyperbola \(\dfrac{y^{2}}{b^{2}}-\dfrac{x^{2}}{a^{2}}=1,\) the branches of the graph open up and down.
EXAMPLE 13Graphing a Hyperbola With Center at the Origin
Graph the equation \(\dfrac{y^{2}}{4}-\dfrac{x^{2}}{5}=1\).
Solution The graph of \(\dfrac{y^{2}}{4}-\dfrac{x^{2}}{5}=1\) is a hyperbola. The hyperbola consists of two branches, one opening up, the other opening down, like the graph in Figure 41(b). The hyperbola has no \(x\) -intercepts. To find the \(y\)-intercepts, we let \(x=0\) and solve for \(y.\) \[ \begin{array}{l} \dfrac{y^{2}}{4}=1 \\[11pt] y^{2}=4 \\[5pt] y=-2\qquad\hbox{ or} \qquad y=2 \end{array} \]
A-25
The \(y\)-intercepts are \(-2\) and \(2\), so the vertices are \((0,-2)\) and (\(0,2\)). The transverse axis is the vertical line \(x=0.\) To graph the hyperbola, let \(y=\pm\, 3\) (or any numbers \(\geq\)\(2\) or \(\leq\)\(-2\)). Then \[ \begin{array}{rclll} \dfrac{y^{2}}{4}-\dfrac{x^{2}}{5}&=&1 & & \\ \dfrac{9}{4}-\dfrac{x^{2}}{5}&=&1 & & {\color{#0066A7}{y=\pm\, 3}} \\ ~\ \ \ \ \ \ \dfrac{x^{2}}{5}&=&\dfrac{5}{4} & & \\ ~\ \ \ \ \ \ \ x^{2}&=&\dfrac{25}{4} & & \\ x=-\dfrac{5}{2} &\hbox{or}& x=\dfrac{5}{2} \\ \end{array} \]
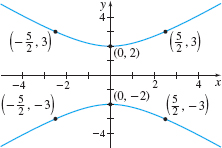
The points \(\left( -\dfrac{5}{2},3\right) \), \(\left( -\dfrac{5}{2},-3\right) \), \(\left( \dfrac{5}{2},3\right) \), and \(\left( \dfrac{5}{2},-3\right)\) are on the hyperbola. See Figure 42 for the graph.


