3.3
Mass Spectrometry is a Powerful Technique for the Identification of Peptides and Proteins
In many instances, the study of a particular biological process in its native context is advantageous. For example, if we are interested in a pathway that is localized to the nucleus of a cell, we might conduct studies on an isolated nuclear extract. In these experiments, identification of the proteins present in the sample is often critical. Antibody-based techniques, such as the ELISA method described in the previous section, can be very helpful toward this goal. However, these techniques are limited to the detection of proteins for which an antibody is already available. Mass spectrometry enables the highly precise and sensitive measurement of the atomic composition of a particular molecule, or analyte, without prior knowledge of its identity. Originally, this method was relegated to the study of the chemical composition and molecular mass of gases or volatile liquids. However, technological advances in the past two decades have dramatically expanded the utility of mass spectrometry to the study of proteins, even those found at very low concentrations within highly complex mixtures, such as the contents of a particular cell type.
Mass spectrometry enables the highly accurate and sensitive detection of the mass of an analyte. This information can be used to determine the identity and chemical state of the molecule of interest. Mass spectrometers operate by converting analyte molecules into gaseous, charged forms (gas-phase ions). Through the application of electrostatic potentials, the ratio of the mass of each ion to its charge (the mass-to-charge ratio, or m/z) can be measured. Although a wide variety of techniques employed by mass spectrometers are used in current practice, each of them comprises three essential components: the ion source, the mass analyzer, and the detector. Let us consider the first two in greater detail, because improvements in them have contributed most significantly to the analysis of biological samples.
The ion source achieves the first critical step in mass spectrometric analysis: conversion of the analyte into gas-phase ions (ionization). Until recently, proteins could not be ionized efficiently because of their high molecular weights and low volatility. However, the development of techniques such as matrix-assisted laser desorption/ionization (MALDI) and electrospray ionization (ESI) has enabled the clearing of this significant hurdle. In MALDI, the analyte is evaporated to dryness in the presence of a volatile, aromatic compound (the matrix) that can absorb light at specific wavelengths. A laser pulse tuned to one of these wavelengths excites and vaporizes the matrix, converting some of the analyte into the gas phase. Subsequent gaseous collisions enable the intermolecular transfer of charge, ionizing the analyte. In ESI, a solution of the analyte is passed through an electrically charged nozzle. Droplets of the analyte, now charged, emerge from the nozzle into a chamber of very low pressure, evaporating the solvent and ultimately yielding the ionized analyte.
The newly formed analyte ions then enter the mass analyzer, where they are distinguished on the basis of their mass-to-charge ratios. There are a number of different types of mass analyzers. For this discussion, we will consider one of the simplest, the time-of-flight (TOF) mass analyzer, in which ions are accelerated through an elongated chamber under a fixed electrostatic potential. Given two ions of identical net charge, the smaller ion will require less time to traverse the chamber than will the larger ion. The mass of each ion can be determined by measuring the time required for each ion to pass through the chamber.
The sequential action of the ion source and the mass analyzer enables the highly sensitive measurement of the mass of potentially massive ions, such as those of proteins. Consider an example of a MALDI ion source coupled to a TOF mass analyzer: the MALDI-TOF mass spectrometer (Figure 3.27). Gas-phase ions generated by the MALDI ion source pass directly into the TOF analyzer, where the mass-to-charge ratios are recorded. In Figure 3.28, the MALDI-TOF mass spectrum of a mixture of 5 pmol each of insulin and lactoglobulin is shown. The masses determined by MALDI-TOF are 5733.9 and 18,364, respectively. A comparison with the calculated values of 5733.5 and 18,388 reveals that MALDI-TOF is clearly an accurate means of determining protein mass.
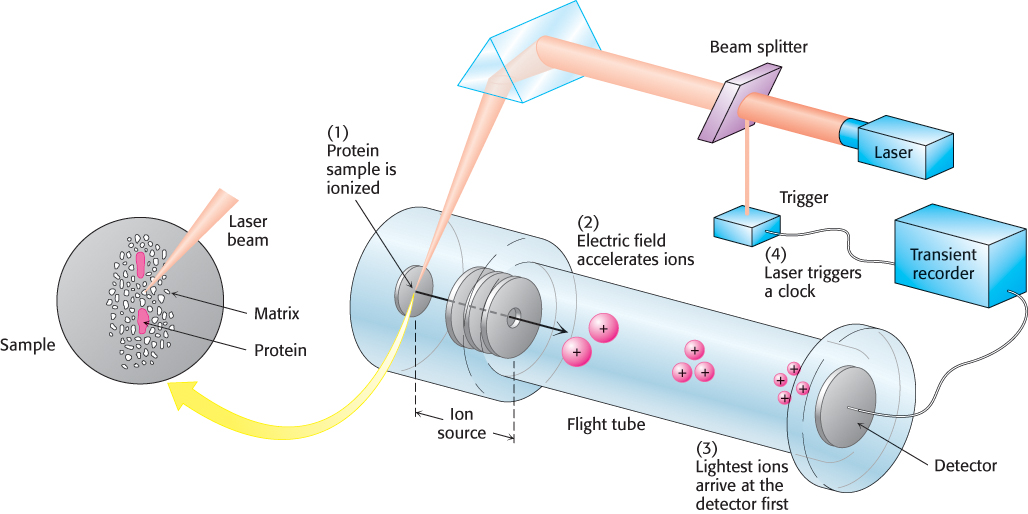
FIGURE 3.27MALDI-TOF mass spectrometry. (1) The protein sample, embedded in an appropriate matrix, is ionized by the application of a laser beam. (2) An electric field accelerates the ions through the flight tube toward the detector. (3) The lightest ions arrive first. (4) The ionizing laser pulse also triggers a clock that measures the time of flight (TOF) for the ions.
[Information from J. T. Watson, Introduction to Mass Spectrometry, 3d ed. (Lippincott-Raven, 1997), p. 279.]
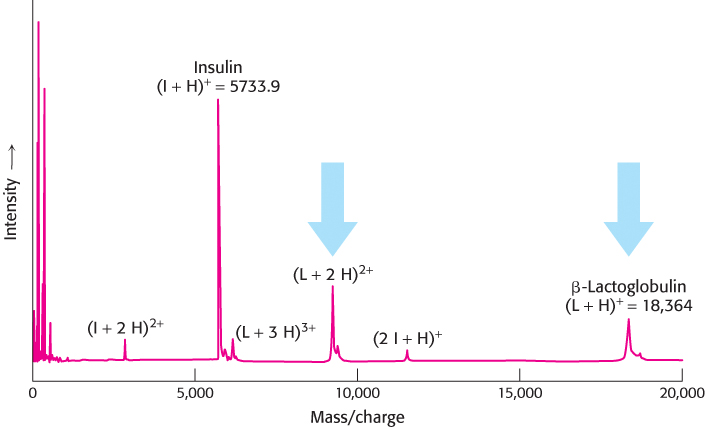
FIGURE 3.28MALDI-TOF mass spectrum of insulin and β-lactoglobulin. A mixture of 5 pmol each of insulin (I) and β-lactoglobulin (L) was ionized by MALDI, which produces predominantly singly charged molecular ions from peptides and proteins—the insulin ion (I+H)+ and the lactoglobulin ion (L+H)+. Molecules with multiple charges, such as those for β-lactoglobulin indicated by the blue arrows, as well as small quantities of a singly charged dimer of insulin (2 I+H)+ also are produced.
[Data from J. T. Watson, Introduction to Mass Spectrometry, 3d ed. (Lippincott-Raven, 1997), p. 282.]
In the ionization process, a family of ions, each of the same mass but carrying different total net charges, is formed from a single analyte. Because the mass spectrometer detects ions on the basis of their mass-to-charge ratio, these ions will appear as separate peaks in the mass spectrum. For example, in the mass spectrum of β-lactoglobulin shown in Figure 3.28, peaks near m/z = 18,364 (corresponding to the +1 charged ion) and m/z = 9,183 (corresponding to the +2 charged ion) are visible (indicated by the blue arrows). Although multiple peaks for the same ion may appear to be a nuisance, they enable the spectrometrist to measure the mass of an analyte ion more than once in a single experiment, improving the overall precision of the calculated result.
Peptides can be sequenced by mass spectrometry
Mass spectrometry is one of several techniques for the determination of the amino acid sequence of a protein. As we shall discuss shortly, this sequence data can be a valuable source of information. For many years, chemical methods were the primary means for peptide sequencing. In the most common of these methods, Edman degradation, the N-terminal amino acid of a polypeptide is labeled with phenyl isothiocyanate. Subsequent cleavage yields the phenylthiohydantoin (PTH)-amino acid derivative, which can be identified by spectroscopic methods, and the polypeptide chain, now shortened by one residue (Figure 3.29). This procedure can then be repeated on the shortened peptide, yielding another PTH–amino acid, which can again be identified by chromatography.
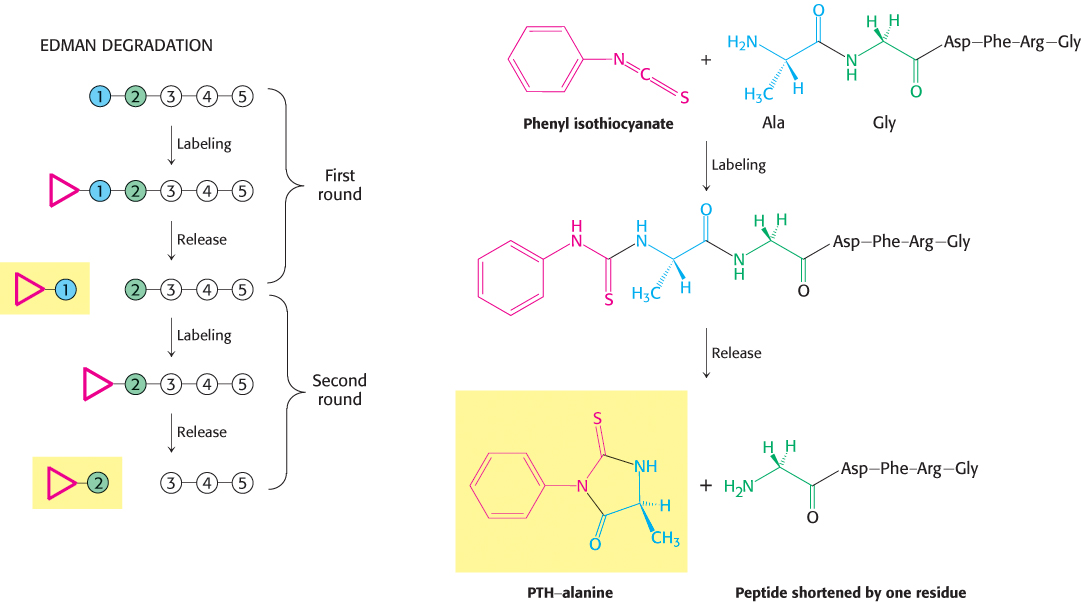
FIGURE 3.29The Edman degradation. The labeled amino-terminal residue (PTH–alanine in the first round) can be released without hydrolyzing the rest of the peptide. Hence, the amino-terminal residue of the shortened peptide (Gly-Asp-Phe-Arg-Gly) can be determined in the second round. Three more rounds of the Edman degradation reveal the complete sequence of the original peptide.
While technological advancements have improved the speed and sensitivity of the Edman degradation, these parameters have largely been surpassed by the application of mass spectrometric methods. The use of mass spectrometry for protein sequencing takes advantage of the fact that ions of proteins that have been analyzed by a mass spectrometer, the precursor ions, can be broken into smaller peptide chains by bombardment with atoms of an inert gas such as helium or argon. These new fragments, or product ions, can be passed through a second mass analyzer for further mass characterization. The utilization of two mass analyzers arranged in this manner is referred to as tandem mass spectrometry. Importantly, the product-ion fragments are formed in chemically predictable ways that can provide clues to the amino acid sequence of the precursor ion. For polypeptide analytes, disruption of individual peptide bonds will yield two smaller peptide ions, containing the sequences before and after the cleavage site. Hence, a family of ions can be detected; each ion represents a fragment of the original peptide with one or more amino acids removed from one end (Figure 3.30A). For simplicity, only the carboxyl-terminal peptide fragments are shown in Figure 3.30A. Figure 3.30B depicts a representative mass spectrum from a fragmented peptide. The mass differences between the peaks in this fragmentation experiment indicate the amino acid sequence of the precursor peptide ion.
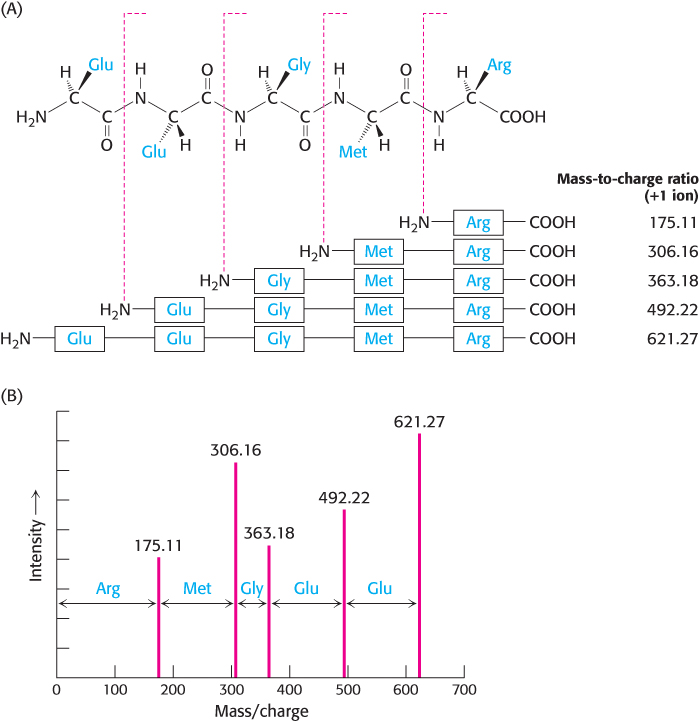
FIGURE 3.30Peptide sequencing by tandem mass spectrometry. (A) Within the mass spectrometer, peptides can be fragmented by bombardment with inert gaseous ions to generate a family of product ions in which individual amino acids have been removed from one end. In this example, the carboxyl fragment of the cleaved peptide bond is ionized. (B) The product ions are detected in the second mass analyzer. The mass differences between the peaks indicate the sequence of amino acids in the precursor ion.
[Data from H. Steen and M. Mann. Nat. Rev. Mol. Cell Biol. 5:699–711, 2004.]
Proteins can be specifically cleaved into small peptides to facilitate analysis
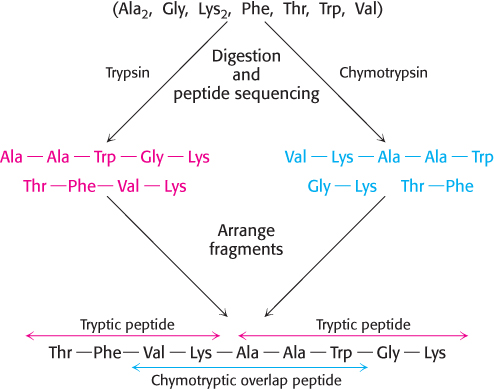
FIGURE 3.31Overlap peptides. The peptide obtained by chymotryptic digestion overlaps two tryptic peptides, establishing their order.
In principle, it should be possible to sequence an entire protein using the Edman degradation or mass spectrometric methods. In practice, the Edman degradation is limited to peptides of 50 residues, because not all peptides in the reaction mixture release the amino acid derivative at each step. For instance, if the efficiency of release for each round were 98%, the proportion of “correct” amino acid released after 60 rounds would be (0.9860), or 0.3—a hopelessly impure mix. Similarly, sequencing of long peptides by mass spectrometry yields a mass spectrum that can be complex and difficult to interpret. This obstacle can be circumvented by cleaving a protein into smaller peptides that can be sequenced. Protein cleavage can be achieved by chemical reagents, such as cyanogen bromide, or proteolytic enzymes, such as trypsin. Table 3.3 gives several other ways of specifically cleaving polypeptide chains. Note that these methods are sequence specific: they disrupt the protein backbone at particular amino acid residues in a predictable manner.
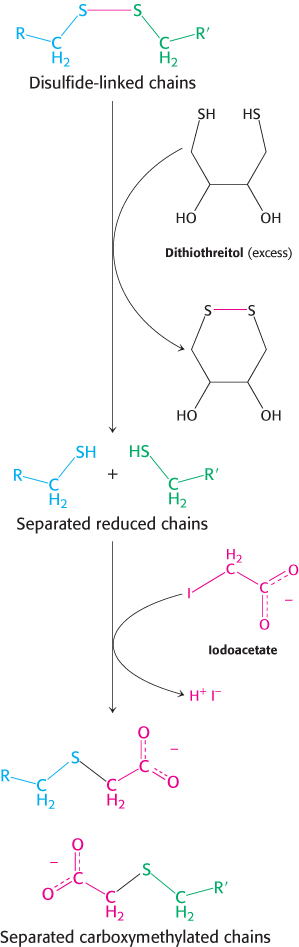
FIGURE 3.32Disulfide-bond reduction. Polypeptides linked by disulfide bonds can be separated by reduction with dithiothreitol followed by alkylation to prevent them from re-forming.
TABLE 3.3 Specific cleavage of polypeptides
|
|
|
|
|
|
|
|
Carboxyl side of methionine residues |
|
|
Carboxyl side of tryptophan residues |
|
|
|
2-Nitro-5-thiocyanobenzoate |
Amino side of cysteine residues |
|
|
|
|
|
Carboxyl side of lysine and arginine residues |
|
|
Carboxyl side of arginine residues |
|
|
Carboxyl side of aspartate and glutamate residues (glutamate only under certain conditions) |
|
|
Carboxyl side of arginine |
|
|
Carboxyl side of tyrosine, tryptophan, phenylalanine, leucine, and methionine |
|
|
Amino side of C-terminal amino acid (not arginine, lysine, or proline) |
The peptides obtained by specific chemical or enzymatic cleavage are separated by some type of chromatography. The sequence of each purified peptide is then determined by the methods described above. At this point, the amino acid sequences of segments of the protein are known, but the order of these segments is not yet defined. How can we order the peptides to obtain the primary structure of the original protein? The necessary additional information is obtained from overlap peptides (Figure 3.31). A second enzyme is used to split the polypeptide chain at different linkages. For example, chymotrypsin cleaves preferentially on the carboxyl side of aromatic and some other bulky nonpolar residues (Chapter 9). Because these chymotryptic peptides overlap two or more tryptic peptides, they can be used to establish the order of the peptides. The entire amino acid sequence of the polypeptide chain is then known.
Additional steps are necessary if the initial protein sample is actually several polypeptide chains. SDS–gel electrophoresis under reducing conditions should display the number of chains. Alternatively, the number of distinct N-terminal amino acids could be determined. After a protein has been identified as being made up of two or more polypeptide chains, denaturing agents, such as urea or guanidine hydrochloride, are used to dissociate chains held together by noncovalent bonds. The dissociated chains must be separated from one another before sequence determination can begin. Polypeptide chains linked by disulfide bonds are separated by reduction with thiols such as β-mercaptoethanol or dithiothreitol. To prevent the cysteine residues from recombining, they are alkylated with iodoacetate to form stable S-carboxymethyl derivatives (Figure 3.32). Sequencing can then be performed as already described.
Genomic and proteomic methods are complementary
Despite the technological advancements in both chemical and mass spectrometric methods of peptide sequencing, heroic effort is required to elucidate the sequence of large proteins, those with more than 1000 residues. For sequencing such proteins, a complementary experimental approach based on recombinant DNA technology is often more efficient. As will be discussed in Chapter 5, long stretches of DNA can be cloned and sequenced, and the nucleotide sequence can be translated to reveal the amino acid sequence of the protein encoded by the gene (Figure 3.33). Recombinant DNA technology is producing a wealth of amino acid sequence information at a remarkable rate.
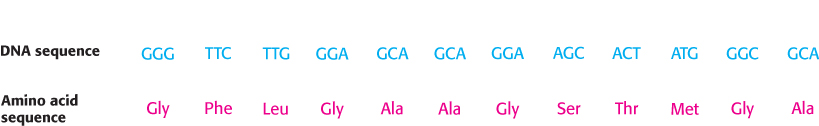
FIGURE 3.33DNA sequence yields the amino acid sequence. The complete nucleotide sequence of HIV-1 (human immunodeficiency virus), the cause of AIDS (acquired immune deficiency syndrome), was determined within a year after the isolation of the virus. A part of the DNA sequence specified by the RNA genome of the virus is shown here with the corresponding amino acid sequence (deduced from a knowledge of the genetic code).
Nevertheless, even with the use of the DNA base sequence to determine primary structure, there is still a need to work with isolated proteins. The amino acid sequence deduced by reading the DNA sequence is that of the nascent protein, the direct product of the translational machinery. However, many proteins undergo posttranslational modifications after their syntheses. Some have their ends trimmed, and others arise by cleavage of a larger initial polypeptide chain. Cysteine residues in some proteins are oxidized to form disulfide links, connecting either parts within a chain or separate polypeptide chains. Specific side chains of some proteins are altered. Amino acid sequences derived from DNA sequences are rich in information, but they do not disclose these modifications. Chemical analyses of proteins in their mature form are needed to delineate the nature of these changes, which are critical for the biological activities of most proteins. Thus, genomic and proteomic analyses are complementary approaches to elucidating the structural basis of protein function.
The amino acid sequence of a protein provides valuable information
Regardless of the method used for its determination, the amino acid sequence of a protein can provide the biochemist with a wealth of information as to the protein’s structure, function, and history.
1. The sequence of a protein of interest can be compared with all other known sequences to ascertain whether significant similarities exist. A search for kinship between a newly sequenced protein and the millions of previously sequenced ones takes only a few seconds on a personal computer (Chapter 6). If the newly isolated protein is a member of an established class of protein, we can begin to infer information about the protein’s structure and function. For instance, chymotrypsin and trypsin are members of the serine protease family, a clan of proteolytic enzymes that have a common catalytic mechanism based on a reactive serine residue (Chapter 9). If the sequence of the newly isolated protein shows sequence similarity with trypsin or chymotrypsin, the result suggests that it may be a serine protease.
2. Comparison of sequences of the same protein in different species yields a wealth of information about evolutionary pathways. Genealogical relationships between species can be inferred from sequence differences between their proteins. If we assume that the random mutation rate of proteins over time is constant, then careful sequence comparison of related proteins between two organisms can provide an estimate for when these two evolutionary lines diverged. For example, a comparison of serum albumins found in primates indicates that human beings and African apes diverged 5 million years ago, not 30 million years ago as was once thought. Sequence analyses have opened a new perspective on the fossil record and the pathway of human evolution.
3. Amino acid sequences can be searched for the presence of internal repeats. Such internal repeats can reveal the history of an individual protein itself. Many proteins apparently have arisen by duplication of primordial genes followed by their diversification. For example, calmodulin, a ubiquitous calcium sensor in eukaryotes, contains four similar calcium-binding modules that arose by gene duplication (Figure 3.34).
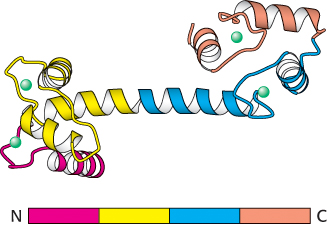
 FIGURE 3.34 Repeating motifs in a protein chain. Calmodulin, a calcium sensor, contains four similar units (shown in red, yellow, blue, and orange) in a single polypeptide chain. Notice that each unit binds a calcium ion (shown in green).
[Drawn from 1CLL.pdb.]
4. Many proteins contain amino acid sequences that serve as signals designating their destinations or controlling their processing. For example, a protein destined for export from a cell or for location in a membrane contains a signal sequence, a stretch of about 20 hydrophobic residues near the amino terminus that directs the protein to the appropriate membrane. Another protein may contain a stretch of amino acids that functions as a nuclear localization signal, directing the protein to the nucleus.
5. Sequence data provide a basis for preparing antibodies specific for a protein of interest. One or more parts of the amino acid sequence of a protein will elicit an antibody when injected into a mouse or rabbit. These specific antibodies can be very useful in determining the amount of a protein present in solution or in the blood, ascertaining its distribution within a cell, or cloning its gene (Section 3.2).
6. Amino acid sequences are valuable for making DNA probes that are specific for the genes encoding the corresponding proteins. Knowledge of a protein’s primary structure permits the use of reverse genetics. DNA sequences that correspond to a part of the amino acid sequence can be constructed on the basis of the genetic code. These DNA sequences can be used as probes to isolate the gene encoding the protein so that the entire sequence of the protein can be determined. The gene in turn can provide valuable information about the physiological regulation of the protein. Protein sequencing is an integral part of molecular genetics, just as DNA cloning is central to the analysis of protein structure and function. We will revisit some of these topics in more detail in Chapter 5.
Individual proteins can be identified by mass spectrometry
The combination of mass spectrometry with chromatographic and peptide-cleavage techniques enables highly sensitive protein identification in complex biological mixtures. When a protein is cleaved by chemical or enzymatic methods (Table 3.3), a specific and predictable family of peptide fragments is formed. We learned in Chapter 2 that each protein has a unique, precisely defined amino acid sequence. Hence, the identity of the individual peptides formed from this cleavage reaction—and, importantly, their corresponding masses—is a distinctive signature for that particular protein. Protein cleavage, followed by chromatographic separation and mass spectrometry, enables rapid identification and quantitation of these signatures, even if they are present at very low concentrations. This technique for protein identification is referred to as peptide mass fingerprinting.
The speed and sensitivity of mass spectrometry has made this technology critical for the study of proteomics. Let us consider the analysis of the nuclear-pore complex from yeast, which facilitates the transport of large molecules into and out of the nucleus. This huge macromolecular complex was purified from yeast cells by careful procedures. The purified complex was fractionated by HPLC followed by gel electrophoresis. Individual bands from the gel were isolated, cleaved with trypsin, and analyzed by MALDI-TOF mass spectrometry. The fragments produced were compared with amino acid sequences deduced from the DNA sequence of the yeast genome as shown in Figure 3.35. A total of 174 nuclear-pore proteins were identified in this manner. Many of these proteins had not previously been identified as being associated with the nuclear pore despite years of study. Furthermore, mass spectrometric methods are sensitive enough to detect essentially all components of the pore if they are present in the samples used. Thus, a complete list of the components constituting this macromolecular complex could be obtained in a straightforward manner. Proteomic analysis of this type is growing in power as mass spectrometric and biochemical fractionation methods are refined.
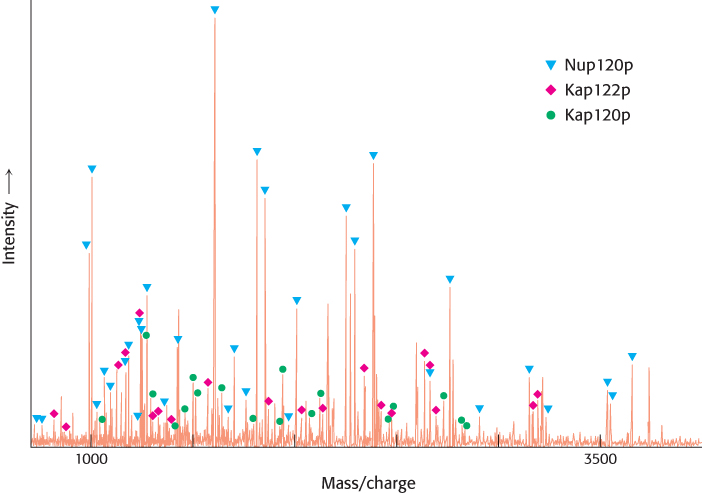
FIGURE 3.35Proteomic analysis by mass spectrometry. This mass spectrum was obtained by analyzing a trypsin-treated band in a gel derived from a yeast nuclear-pore sample. Many of the peaks were found to match the masses predicted for peptide fragments from three proteins (Nup120p, Kap122p, and Kap120p) within the yeast genome. The band corresponded to an apparent molecular mass of 100 kDa.
[Data from M. P. Rout, J. D. Aitchison, A. Suprapto, K. Hjertaas, Y. Zhao, and B. T. Chait. J. Cell Biol. 148:635–651, 2000.]