X-ray crystallography reveals three-dimensional structure in atomic detail
X-ray crystallography was the first method developed to determine protein structure in atomic detail. This technique provides the clearest visualization of the precise three-dimensional positions of most atoms within a protein. Of all forms of radiation, x-rays provide the best resolution for the determination of molecular structures because their wavelength approximately corresponds to the length of a covalent bond. The three components in an x-ray crystallographic analysis are a protein crystal, a source of x-rays, and a detector (Figure 3.38).
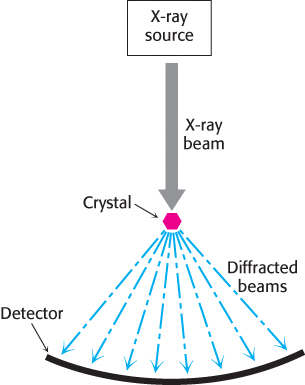
FIGURE 3.38An x-ray crystallographic experiment. An x-ray source generates a beam, which is diffracted by a crystal. The resulting diffraction pattern is collected on a detector.
X-ray crystallography first requires the preparation of a protein or protein complex in crystal form, in which all protein molecules are oriented in a fixed, repeated arrangement with respect to one another. Slowly adding ammonium sulfate or another salt to a concentrated solution of protein to reduce its solubility favors the formation of highly ordered crystals—the process of salting out discussed in Section 3.1. For example, myoglobin crystallizes in 3 M ammonium sulfate. Protein crystallization can be quite challenging: a concentrated solution of highly pure material is required and it is often difficult to predict which experimental conditions will yield the most-effective crystals. Methods for screening many different crystallization conditions using a small amount of protein sample have been developed. Typically, hundreds of conditions must be tested to obtain crystals fully suitable for crystallographic studies. Nevertheless, increasingly large and complex proteins have been crystallized. For example, poliovirus, an 8500-kDa assembly of 240 protein subunits surrounding an RNA core, has been crystallized and its structure solved by x-ray methods. Crucially, proteins frequently crystallize in their biologically active configuration. Enzyme crystals may display catalytic activity if the crystals are suffused with substrate.
After a suitably pure crystal of protein has been obtained, a source of x-rays is required. A beam of x-rays of wavelength 1.54 Å is produced by accelerating electrons against a copper target. Equipment suitable for generating x-rays in this manner is available in many laboratories. Alternatively, x-rays can be produced by synchrotron radiation, the acceleration of electrons in circular orbits at speeds close to the speed of light. Synchrotron-generated x-ray beams are much more intense than those generated by electrons hitting copper. The higher intensity enables the acquisition of high quality data from smaller crystals over a shorter exposure times. Several facilities throughout the world generate synchrotron radiation, such as the Advanced Light Source at Argonne National Laboratory outside Chicago and the Photon Factory in Tsukuba City, Japan.
When a narrow beam of x-rays is directed at the protein crystal, most of the beam passes directly through the crystal while a small part is scattered in various directions. These scattered, or diffracted, x-rays can be detected by x-ray film or by a solid-state electronic detector. The scattering pattern provides abundant information about protein structure. The basic physical principles underlying the technique are:
1. Electrons scatter x-rays. The amplitude of the wave scattered by an atom is proportional to its number of electrons. Thus, a carbon atom scatters six times as strongly as a hydrogen atom does.
2. The scattered waves recombine. Each diffracted beam comprises waves scattered by each atom in the crystal. The scattered waves reinforce one another at the film or detector if they are in phase (in step) there, and they cancel one another if they are out of phase.
3. The way in which the scattered waves recombine depends only on the atomic arrangement.
The protein crystal is mounted and positioned in a precise orientation with respect to the x-ray beam and the film. The crystal is rotated so that the beam can strike the crystal from many directions. This rotational motion results in an x-ray photograph consisting of a regular array of spots called reflections. The x-ray photograph shown in Figure 3.39 is a two-dimensional section through a three-dimensional array of 72,000 reflections. The intensities and positions of these reflections are the basic experimental data of an x-ray crystallographic analysis. Each reflection is formed from a wave with an amplitude proportional to the square root of the observed intensity of the spot. Each wave also has a phase—that is, the timing of its crests and troughs relative to those of other waves. Additional experiments or calculations must be performed to determine the phases corresponding to each reflection.
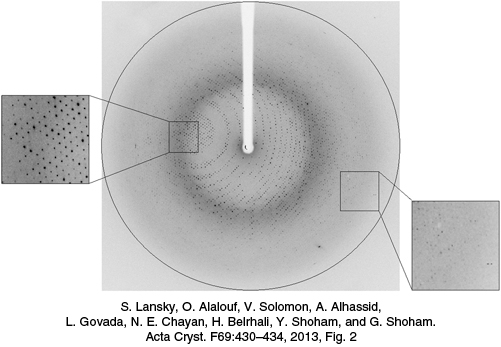
FIGURE 3.39An x-ray diffraction pattern. A protein crystal diffracts x-rays to produce a pattern of spots, or reflections, on the detector surface. The white silhouette in the center of the image is from a beam stop which protects the detector from the intense, undiffracted x-rays.
[S. Lansky, O. Alalouf, V. Solomon, A. Alhassid, L. Govada, N. E. Chayan, H. Belrhali, Y. Shoham, and G. Shoham. Acta Cryst. F69:430–434, 2013, Fig. 2.]
The next step is to reconstruct an image of the protein from the observed reflections. In light microscopy or electron microscopy, the diffracted beams are focused by lenses to directly form an image. However, appropriate lenses for focusing x-rays do not exist. Instead, the image is formed by applying a mathematical relation called a Fourier transform to the measured amplitudes and calculated phases of every observed reflection. The image obtained is referred to as the electron-density map. It is a three-dimensional graphic representation of where the electrons are most densely localized and is used to determine the positions of the atoms in the crystallized molecule (Figure 3.40). Critical to the interpretation of the map is its resolution, which is determined by the number of scattered intensities used in the Fourier transform. The fidelity of the image depends on this resolution, as shown by the optical analogy in Figure 3.41. A resolution of 6 Å reveals the course of the polypeptide chain but few other structural details. The reason is that polypeptide chains pack together so that their centers are between 5 Å and 10 Å apart. Maps at higher resolution are needed to delineate groups of atoms, which lie between 2.8 Å and 4.0 Å apart, and individual atoms, which are between 1.0 Å and 1.5 Å apart (Figure 3.42). The ultimate resolution of an x-ray analysis is determined by the degree of perfection of the crystal. For proteins, this limiting resolution is often about 2 Å; however, in exceptional cases, resolutions of 1.0 Å have been obtained.
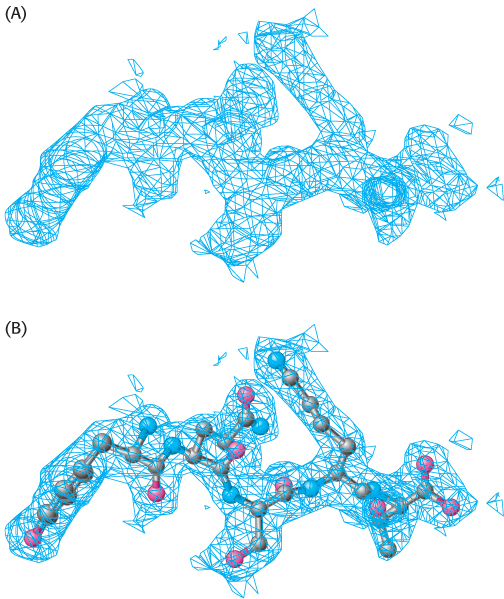
FIGURE 3.40Interpretation of an electron-density map. (A) A segment of an electron-density map is drawn as a three-dimensional contour plot, in which the regions inside the “cage” represent the regions of highest electron density. (B) A model of the protein is built into this map so as to maximize the placement of atoms within this density.
[Drawn from 1FCH.pdb.]
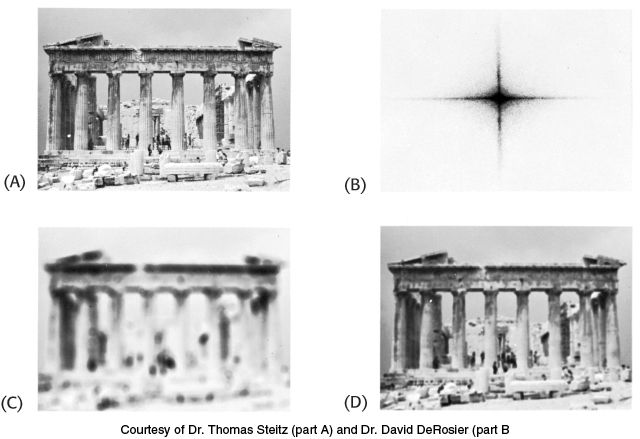
FIGURE 3.41Resolution affects the quality of an image. The effect of resolution on the quality of a reconstructed image is shown by an optical analog of x-ray diffraction: (A) a photograph of the Parthenon; (B) an optical diffraction pattern of the Parthenon; (C and D) images reconstructed from the pattern in part B. More data were used to obtain image D than image C, which accounts for the higher quality of image D.
[Courtesy of Dr. Thomas Steitz (part A) and Dr. David DeRosier (part B).]
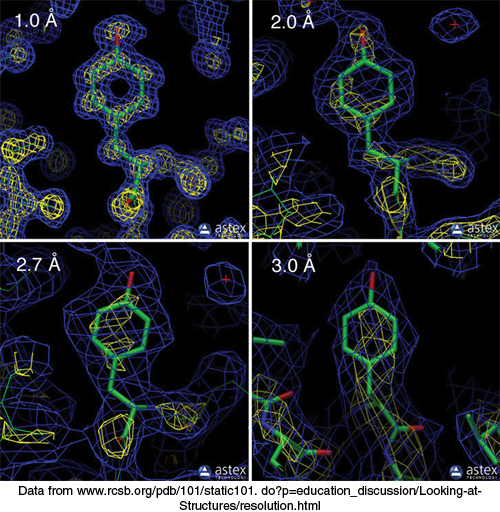
FIGURE 3.42Resolution affects the quality of the electron density map. The electron density maps of a tyrosine residue at four different resolution levels (1.0 Å, 2.0 Å, 2.7 Å, and 3.0 Å) are shown. At the lower resolution levels (2.7 Å and 3.0 Å), only a group of atoms corresponding to the side chain is visible, whereas at the highest resolution (1.0 Å), individual atoms within the side chain are distinguishable.
Nuclear magnetic resonance spectroscopy can reveal the structures of proteins in solution
X-ray crystallography is the most powerful method for determining protein structures. However, some proteins do not readily crystallize. Furthermore, although structures of crystallized proteins very closely represent those of proteins free of the constraints imposed by the crystalline environment, structures in solution can be sources of additional insights. Nuclear magnetic resonance (NMR) spectroscopy is unique in being able to reveal the atomic structure of macromolecules in solution, provided that highly concentrated solutions (~1 mM, or 15 mg ml−1 for a 15-kDa protein) can be obtained. This technique depends on the fact that certain atomic nuclei are intrinsically magnetic. Only a limited number of isotopes display this property, called spin, and those most important to biochemistry are listed in Table 3.4. The simplest example is the hydrogen nucleus (1H), which is a proton. The spinning of a proton generates a magnetic moment. This moment can take either of two orientations, or spin states (called α and β), when an external magnetic field is applied (Figure 3.43). The energy difference between these states is proportional to the strength of the imposed magnetic field. The α state has a slightly lower energy because it is aligned with this applied field. Hence, in a given population of nuclei, slightly more will occupy the α state (by a factor of the order of 1.00001 in a typical experiment). A spinning proton in an α state can be raised to an excited state (β state) by applying a pulse of electromagnetic radiation (a radio-frequency, or RF, pulse), provided that the frequency corresponds to the energy difference between the α and the β states. In these circumstances, the spin will change from α to β; in other words, resonance will be obtained.
TABLE 3.4 Biologically important nuclei giving NMR signals
|
|
Natural abundance (% by weight of the element) |
|
|
|
|
|
|
|
|
|
|
|
|
|
|
|
|
|
|
|
|
|
|
|
|
|
|
|
|
|
|
|
|
|
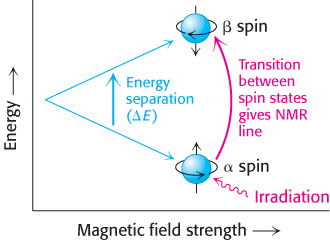
FIGURE 3.43Basis of NMR spectroscopy. The energies of the two orientations of a nucleus of spin ½ (such as 31P and 1H) depend on the strength of the applied magnetic field. Absorption of electromagnetic radiation of appropriate frequency induces a transition from the lower to the upper level.
These properties can be used to examine the chemical surroundings of the hydrogen nucleus. The flow of electrons around a magnetic nucleus generates a small local magnetic field that opposes the applied field. The degree of such shielding depends on the surrounding electron density. Consequently, nuclei in different environments will change states, or resonate, at slightly different field strengths or radiation frequencies. A resonance spectrum for a molecule is obtained by keeping the magnetic field constant and varying the frequency of the electromagnetic radiation. The nuclei of the perturbed sample absorb electromagnetic radiation at a frequency that can be measured. The different frequencies, termed chemical shifts, are expressed in fractional units δ (parts per million, or ppm) relative to the shifts of a standard compound, such as a water-soluble derivative of tetramethylsilane, that is added with the sample. For example, a —CH3 proton typically exhibits a chemical shift (δ) of 1 ppm, compared with a chemical shift of 7 ppm for an aromatic proton. The chemical shifts of most protons in protein molecules fall between 0 and 9 ppm (Figure 3.44). Most protons in many proteins can be resolved by using this technique of one-dimensional NMR. With this information, we can then deduce changes to a particular chemical group under different conditions, such as the conformational change of a protein from a disordered structure to an α helix in response to a change in pH.
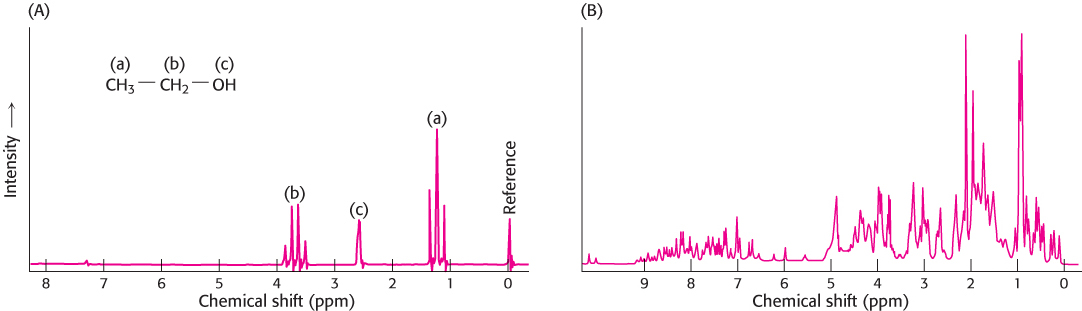
FIGURE 3.44One-dimensional NMR spectra. (A) 1H-NMR spectrum of ethanol (CH3CH2OH) shows that the chemical shifts for the hydrogen are clearly resolved. (B) 1H-NMR spectrum of a 55 amino acid fragment of a protein having a role in RNA splicing shows a greater degree of complexity. A large number of peaks are present and many overlap.
[(A) Data from C. Branden and J. Tooze, Introduction to Protein Structure (Garland, 1991), p. 280; (B) courtesy of Dr. Barbara Amann and Dr. Wesley McDermott.]
We can garner even more information by examining how the spins on different protons affect their neighbors. By inducing a transient magnetization in a sample through the application of a radio-frequency pulse, we can alter the spin on one nucleus and examine the effect on the spin of a neighboring nucleus. Especially revealing is a two-dimensional spectrum obtained by nuclear Overhauser enhancement spectroscopy (NOESY), which graphically displays pairs of protons that are in close proximity, even if they are not close together in the primary structure. The basis for this technique is the nuclear Overhauser effect (NOE), an interaction between nuclei that is proportional to the inverse sixth power of the distance between them. Magnetization is transferred from an excited nucleus to an unexcited one if the two nuclei are less than about 5 Å apart (Figure 3.45A). In other words, the effect provides a means of detecting the location of atoms relative to one another in the three-dimensional structure of the protein. The peaks that lie along the diagonal of a NOESY spectrum (shown in white in Figure 3.45B) correspond to those present in a one-dimensional NMR experiment. The peaks apart from the diagonal (shown in red in Figure 3.45B), referred to as off-diagonal peaks or cross-peaks, provide crucial new information: they identify pairs of protons that are less than 5 Å apart. A two-dimensional NOESY spectrum for a protein comprising 55 amino acids is shown in Figure 3.46. The large number of off-diagonal peaks reveals short proton–proton distances. The three-dimensional structure of a protein can be reconstructed with the use of such proximity relations. Structures are calculated such that protons that must be separated by less than 5 Å on the basis of NOESY spectra are close to one another in the three-dimensional structure (Figure 3.47). If a sufficient number of distance constraints are applied, the three-dimensional structure can nearly be determined uniquely.
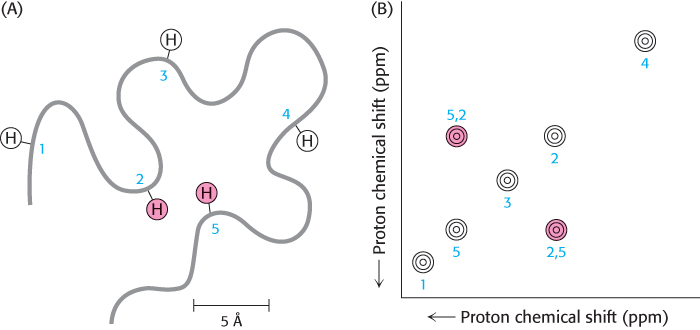
FIGURE 3.45The nuclear Overhauser effect. The nuclear Overhauser effect (NOE) identifies pairs of protons that are in close proximity. (A) Schematic representation of a polypeptide chain highlighting five particular protons. Protons 2 and 5 are in close proximity (~4 Å apart), whereas other pairs are farther apart. (B) A highly simplified NOESY spectrum. The diagonal shows five peaks corresponding to the five protons in part A. The peak above the diagonal and the symmetrically related one below reveal that proton 2 is close to proton 5.
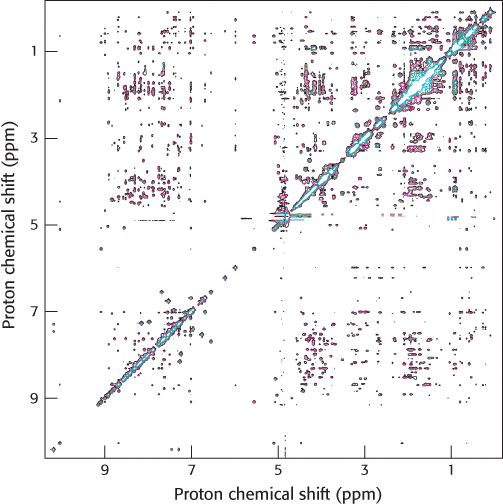
FIGURE 3.46Detecting short proton–proton distances. A NOESY spectrum for a 55 amino acid domain from a protein having a role in RNA splicing. Each off-diagonal peak corresponds to a short proton–proton separation. This spectrum reveals hundreds of such short proton–proton distances, which can be used to determine the three-dimensional structure of this domain.
[Courtesy of Dr. Barbara Amann and Dr. Wesley McDermott.]
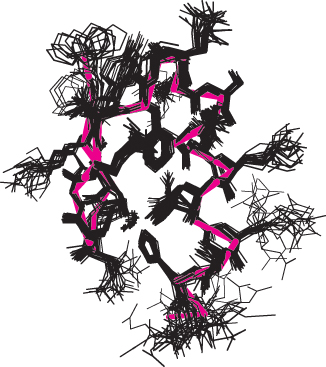
FIGURE 3.48A family of structures. A set of 25 structures for a 28 amino acid domain from a zinc-finger-DNA-binding protein. The red line traces the average course of the protein backbone. Each of these structures is consistent with hundreds of constraints derived from NMR experiments. The differences between the individual structures are due to a combination of imperfections in the experimental data and the dynamic nature of proteins in solution.
[Courtesy of Dr. Barbara Amann.]
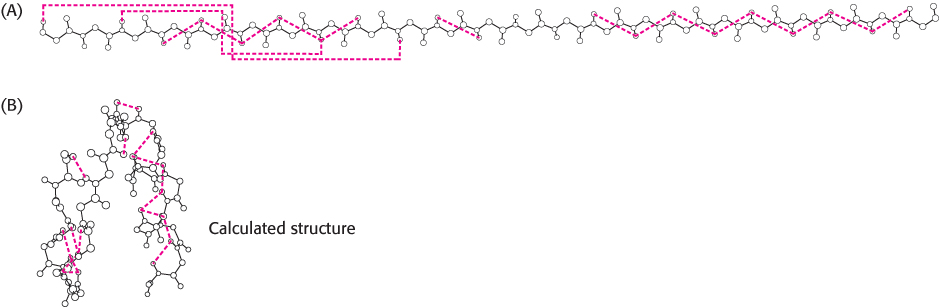
FIGURE 3.47Structures calculated on the basis of NMR constraints. (A) NOESY observations show that protons (connected by dotted red lines) are close to one another in space. (B) A three-dimensional structure calculated with these proton pairs constrained to be close together.
In practice, a family of related structures is generated by NMR spectroscopy for three reasons (Figure 3.48). First, not enough constraints may be experimentally accessible to fully specify the structure. Second, the distances obtained from analysis of the NOESY spectrum are only approximate. Finally, the experimental observations are made not on single molecules but on a large number of molecules in solution that may have slightly different structures at any given moment. Thus, the family of structures generated from NMR structure analysis indicates the range of conformations for the protein in solution. At present, structural determination by NMR spectroscopy is generally limited to proteins less than 50 kDa, but its resolving power is certain to increase. The power of NMR has been greatly enhanced by the ability of recombinant DNA technology to produce proteins labeled uniformly or at specific sites with 13C, 15N, and 2H (Chapter 5).
The structures of nearly 97,000 proteins had been elucidated by x-ray crystallography and NMR spectroscopy by the end of 2013 and several new structures are now determined each day. The coordinates are collected at the Protein Data Bank (www.pdb.org), and the structures can be accessed for visualization and analysis. Knowledge of the detailed molecular architecture of proteins has been a source of insight into how proteins recognize and bind other molecules, how they function as enzymes, how they fold, and how they evolved. This extraordinarily rich harvest is continuing at a rapid pace and is greatly influencing the entire field of biochemistry as well as other biological and physical sciences.